

Question: Question 3 - (12 marks) The following table provides monthly sales ($1000) at a college bookstore. The sales show a seasonal pattern, with the greatest
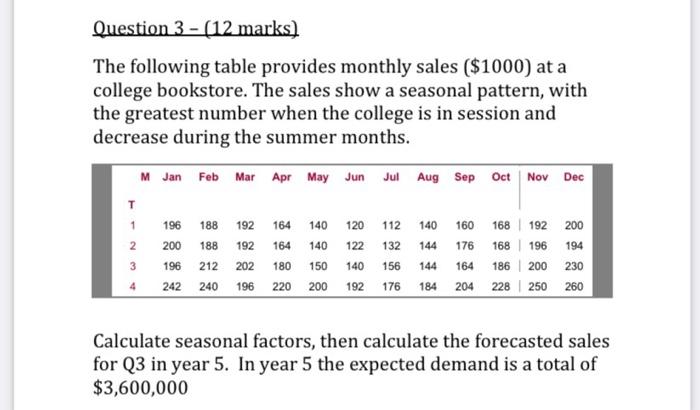
Question 3 - (12 marks) The following table provides monthly sales ($1000) at a college bookstore. The sales show a seasonal pattern, with the greatest number when the college is in session and decrease during the summer months. M Jan Feb Mar Apr May Jun Jul Aug Sep Oct Nov Dec T 1 140 2 122 144 196 188 192 164 140 120 112 200 188 192 164 140 132 212202 180 150 140 242 240 196 220 200 192 176 160 168 192 200 176 168 196 194 164 186 200 230 204 228 250 260 3 196 156 144 184 Calculate seasonal factors, then calculate the forecasted sales for Q3 in year 5. In year 5 the expected demand is a total of $3,600,000
Step by Step Solution
There are 3 Steps involved in it
1 Expert Approved Answer
Step: 1 Unlock

Question Has Been Solved by an Expert!
Get step-by-step solutions from verified subject matter experts
Step: 2 Unlock
Step: 3 Unlock