

Question: Question 3 2 pts S S2 S1 S1 S2 B SI S2 Graph 1 Graph 2 Graph 3 Graph 4 Problem 1 c: Supply Graphs:
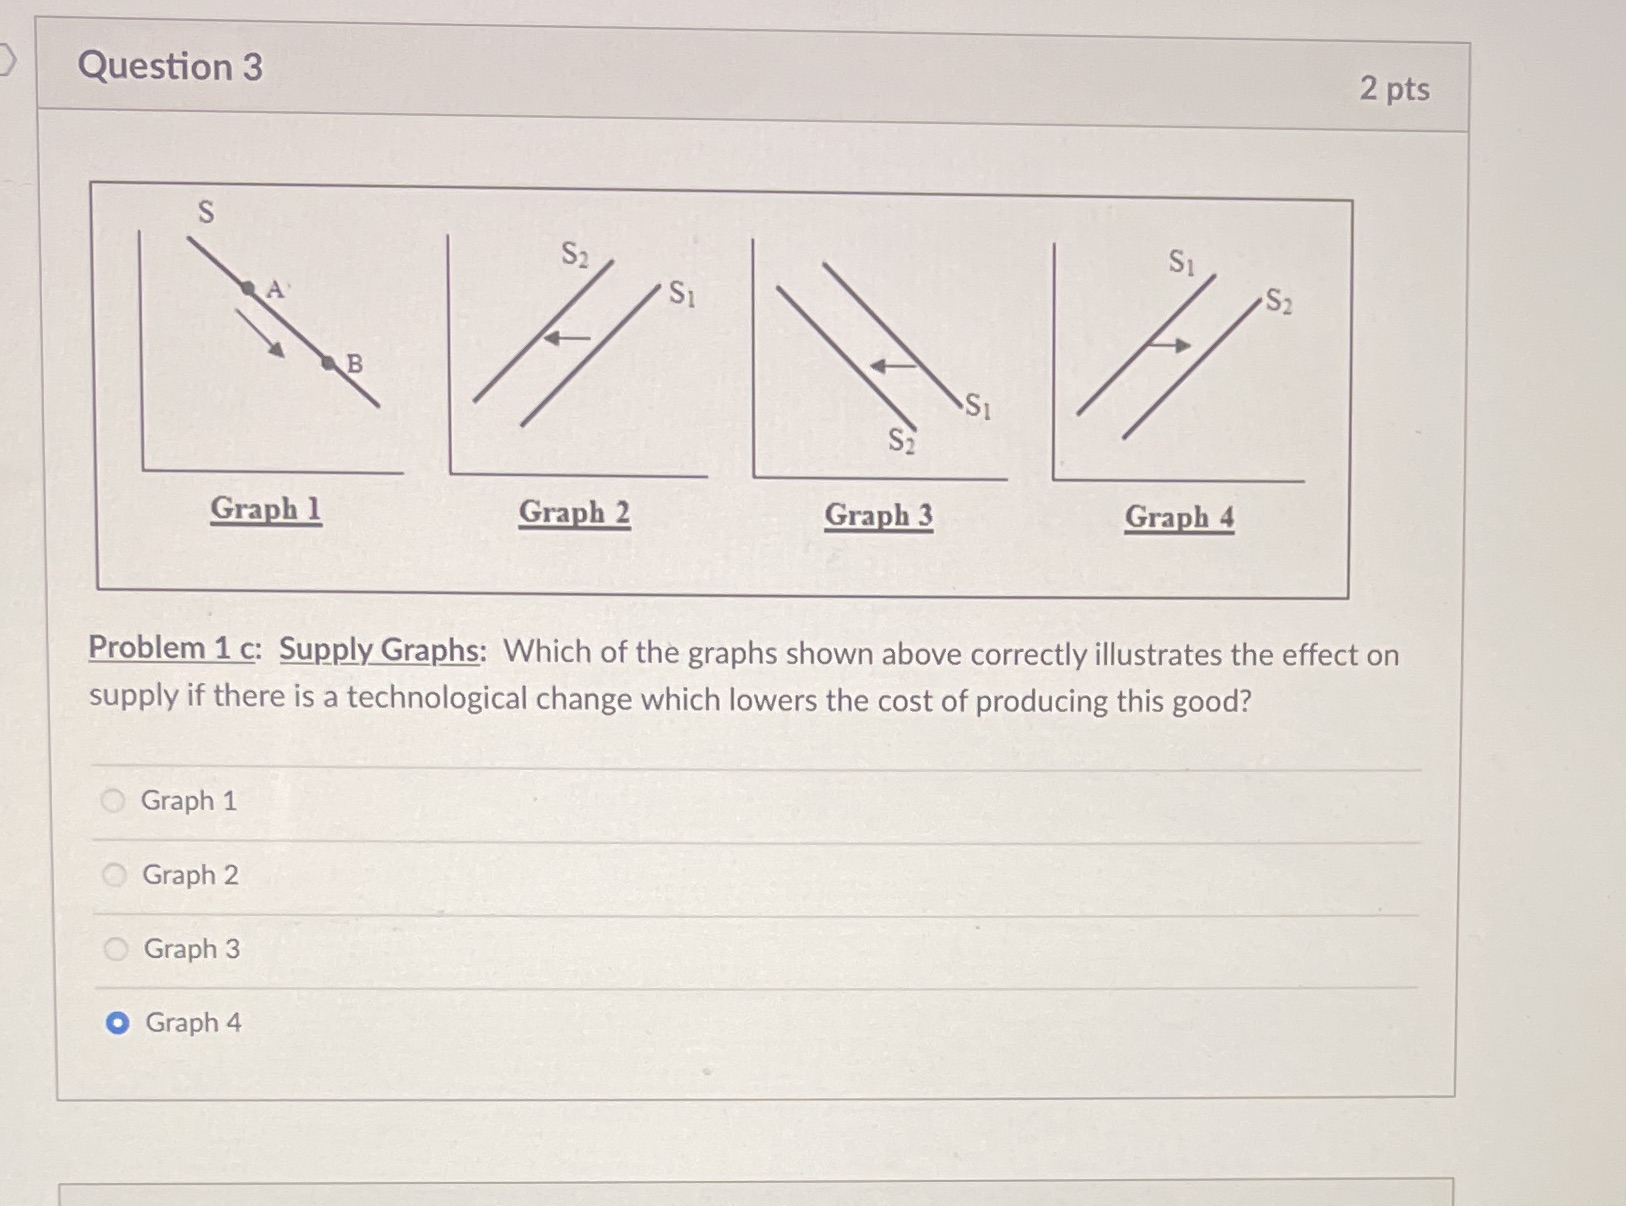

Question 3 2 pts S S2 S1 S1 S2 B SI S2 Graph 1 Graph 2 Graph 3 Graph 4 Problem 1 c: Supply Graphs: Which of the graphs shown above correctly illustrates the effect on supply if there is a technological change which lowers the cost of producing this good? Graph 1 Graph 2 Graph 3 O Graph 4
Step by Step Solution
There are 3 Steps involved in it
1 Expert Approved Answer
Step: 1 Unlock

Question Has Been Solved by an Expert!
Get step-by-step solutions from verified subject matter experts
Step: 2 Unlock
Step: 3 Unlock