

Question: Question 4 2 pts D2 D1 B DI ND 2 DZ DI Graph 1 Graph 2 Graph 3 Graph 4 Problem 1 d: Demand Graphs:
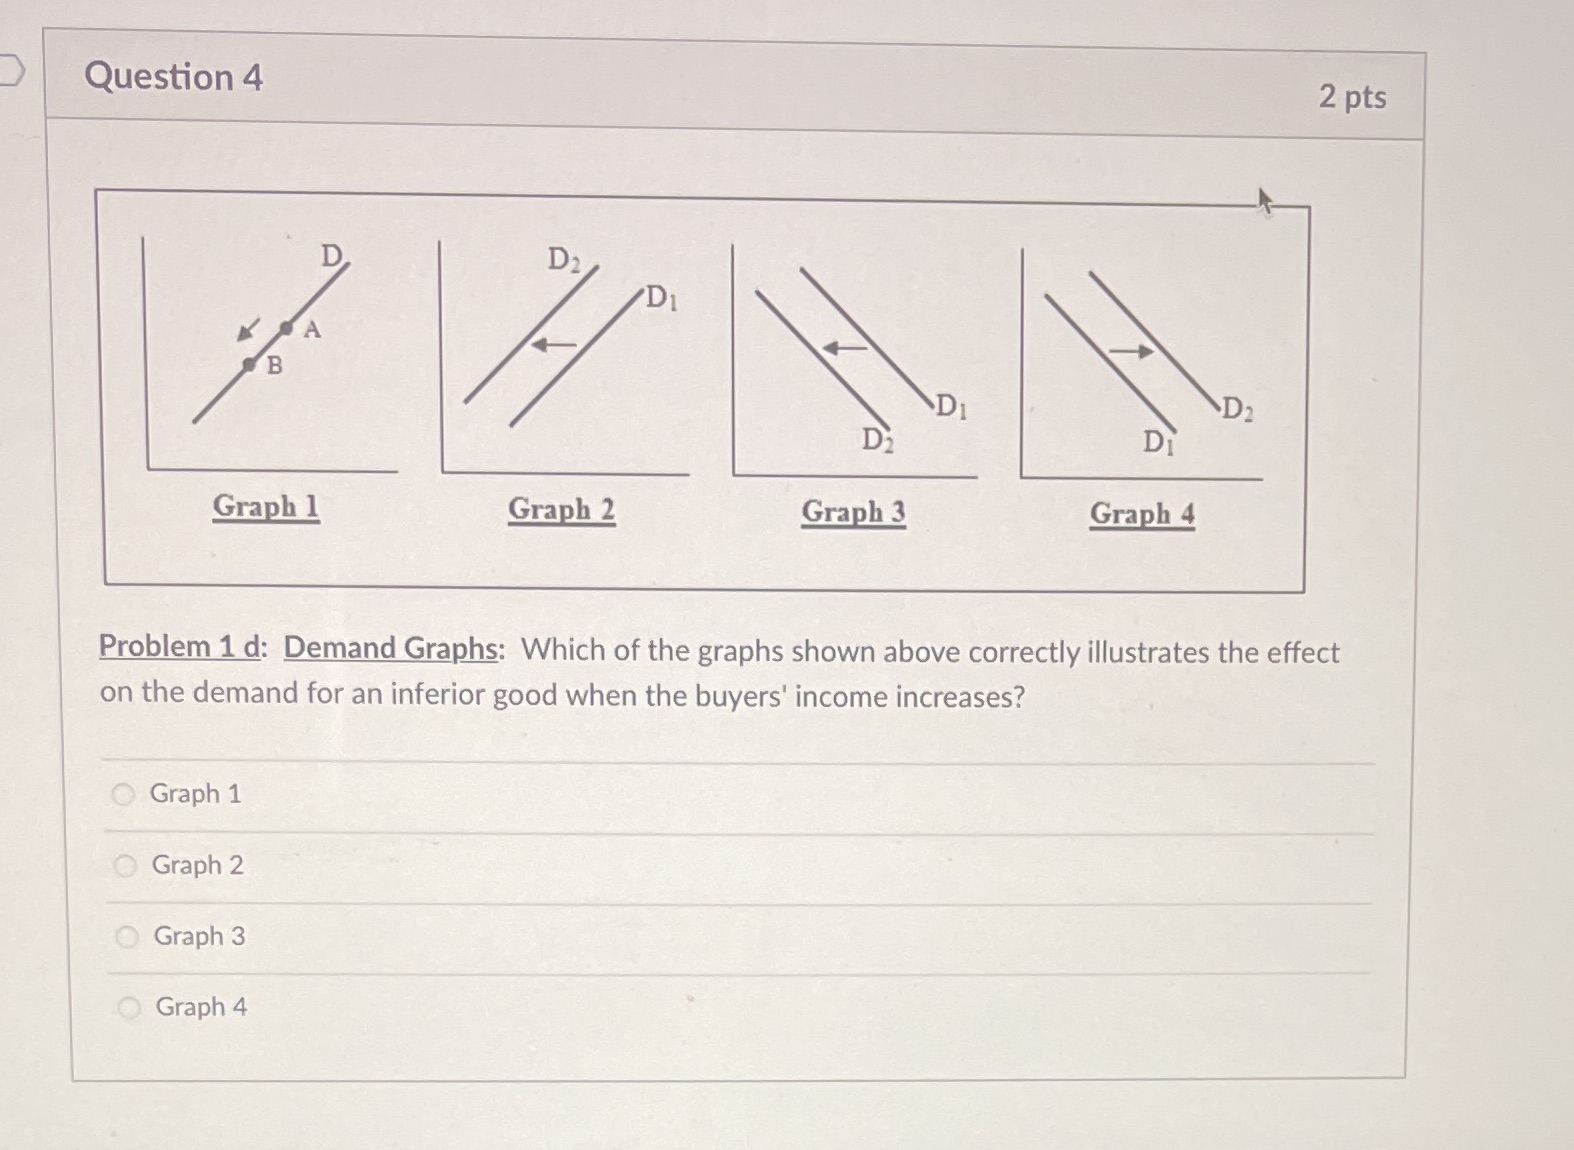

Question 4 2 pts D2 D1 B DI ND 2 DZ DI Graph 1 Graph 2 Graph 3 Graph 4 Problem 1 d: Demand Graphs: Which of the graphs shown above correctly illustrates the effect on the demand for an inferior good when the buyers' income increases? Graph 1 Graph 2 Graph 3 Graph 4
Step by Step Solution
There are 3 Steps involved in it
1 Expert Approved Answer
Step: 1 Unlock

Question Has Been Solved by an Expert!
Get step-by-step solutions from verified subject matter experts
Step: 2 Unlock
Step: 3 Unlock