

Question: Question 3 22 marks You should be able to answer this question after working through Unit 12. Below are some notes made by a statistician
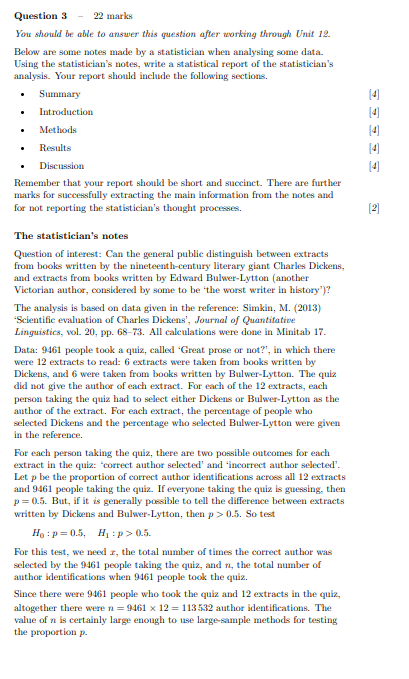
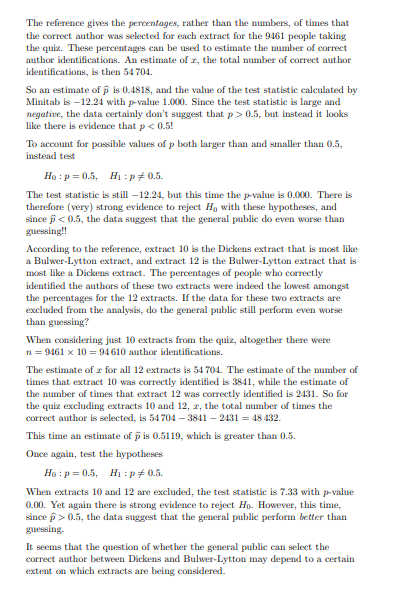
Question 3 22 marks You should be able to answer this question after working through Unit 12. Below are some notes made by a statistician when analysing some data. Using the statistician's notes, write a statistical report of the statistician's analysis. Your report should include the following sections. Summary . Introduction Methods . Results Discussion Remember that your report should be short and succinct. There are further marks for successfully extracting the main information from the notes and for not reporting the statistician's thought processes. 14 14 [2] The statistician's notes Question of interest: Can the general public distinguish between extracts from books written by the nineteenth-century literary giant Charles Dickens, and extracts from books written by Edward Bulwer-Lytton another Victorian author, considered by some to be the worst writer in history')? The analysis is based on data given in the reference: Simkin, M. (2013) Scientific evaluation of Charles Dickens', Journal of Quantitative Linguistics, vol. 20, pp. 68-73. All calculations were done in Minitab 17. Data: 9461 people took a quiz, called "Great prose or not?', in which there were 12 extracts to read: 6 extracts were taken from books written by Dickens, and 6 were taken from books written by Bulwer-Lytton. The quiz did not give the author of each extract. For each of the 12 extracts, each person taking the quiz had to select either Dickens or Bulwer-Lytton as the author of the extract. For each extract, the percentage of people who selected Dickens and the percentage who selected Bulwer-Lytton were given in the reference. For each person taking the quiz, there are two possible outcomes for each extract in the quiz: "correct author selected' and 'incorrect author selected'. Let p be the proportion of correct author identifications across all 12 extracts and 9461 people taking the quiz. If everyone taking the quiz is guessing, then p=0.5. But, if it is generally possible to tell the difference between extracts written by Dickens and Bulwer-Lytton, then p > 0.5. So test H:P = 0.5, H. :p> 0.5. For this test, we need 1, the total number of times the correct author was selected by the 9461 people taking the quiz, and n, the total number of author identifications when 9461 people took the quiz. Since there were 9461 people who took the quiz and 12 extracts in the quiz, altogether there were n = 9461 x 12 = 113532 author identifications. The value of ne is certainly large enough to use large-sample methods for testing the proportion p. The reference gives the percentages, rather than the numbers, of times that the correct author was selected for each extract for the 9461 people taking the quiz. These percentages can be used to estimate the number of correct author identifications. An estimate of t, the total number of correct author identifications, is then 54 704 So an estimate of p is 0.4818, and the value of the test statistic calculated by Minitab is -12.24 with p-value 1.000. Since the test statistic is large and negative, the data certainly don't suggest that p>0.5, but instead it looks like there is evidence that p 0.5, the data suggest that the general public perform better than guessing It seems that the question of whether the general public can select the correct author between Dickens and Bulwer-Lytton may depend to a certain extent on which extracts are being considered. Question 3 22 marks You should be able to answer this question after working through Unit 12. Below are some notes made by a statistician when analysing some data. Using the statistician's notes, write a statistical report of the statistician's analysis. Your report should include the following sections. Summary . Introduction Methods . Results Discussion Remember that your report should be short and succinct. There are further marks for successfully extracting the main information from the notes and for not reporting the statistician's thought processes. 14 14 [2] The statistician's notes Question of interest: Can the general public distinguish between extracts from books written by the nineteenth-century literary giant Charles Dickens, and extracts from books written by Edward Bulwer-Lytton another Victorian author, considered by some to be the worst writer in history')? The analysis is based on data given in the reference: Simkin, M. (2013) Scientific evaluation of Charles Dickens', Journal of Quantitative Linguistics, vol. 20, pp. 68-73. All calculations were done in Minitab 17. Data: 9461 people took a quiz, called "Great prose or not?', in which there were 12 extracts to read: 6 extracts were taken from books written by Dickens, and 6 were taken from books written by Bulwer-Lytton. The quiz did not give the author of each extract. For each of the 12 extracts, each person taking the quiz had to select either Dickens or Bulwer-Lytton as the author of the extract. For each extract, the percentage of people who selected Dickens and the percentage who selected Bulwer-Lytton were given in the reference. For each person taking the quiz, there are two possible outcomes for each extract in the quiz: "correct author selected' and 'incorrect author selected'. Let p be the proportion of correct author identifications across all 12 extracts and 9461 people taking the quiz. If everyone taking the quiz is guessing, then p=0.5. But, if it is generally possible to tell the difference between extracts written by Dickens and Bulwer-Lytton, then p > 0.5. So test H:P = 0.5, H. :p> 0.5. For this test, we need 1, the total number of times the correct author was selected by the 9461 people taking the quiz, and n, the total number of author identifications when 9461 people took the quiz. Since there were 9461 people who took the quiz and 12 extracts in the quiz, altogether there were n = 9461 x 12 = 113532 author identifications. The value of ne is certainly large enough to use large-sample methods for testing the proportion p. The reference gives the percentages, rather than the numbers, of times that the correct author was selected for each extract for the 9461 people taking the quiz. These percentages can be used to estimate the number of correct author identifications. An estimate of t, the total number of correct author identifications, is then 54 704 So an estimate of p is 0.4818, and the value of the test statistic calculated by Minitab is -12.24 with p-value 1.000. Since the test statistic is large and negative, the data certainly don't suggest that p>0.5, but instead it looks like there is evidence that p 0.5, the data suggest that the general public perform better than guessing It seems that the question of whether the general public can select the correct author between Dickens and Bulwer-Lytton may depend to a certain extent on which extracts are being considered
Step by Step Solution
There are 3 Steps involved in it

Get step-by-step solutions from verified subject matter experts