

Question: The table below shows the durations and planned costs of each activity of an IT project. The project has been running so far for
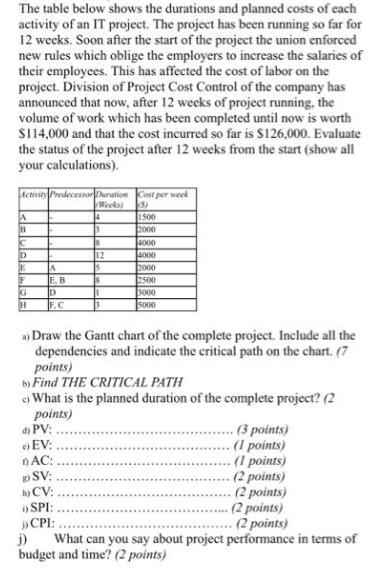
The table below shows the durations and planned costs of each activity of an IT project. The project has been running so far for 12 weeks. Soon after the start of the project the union enforced new rules which oblige the employers to increase the salaries of their employees. This has affected the cost of labor on the project. Division of Project Cost Control of the company has announced that now, after 12 weeks of project running, the volume of work which has been completed until now is worth $114,000 and that the cost incurred so far is $126,000. Evaluate the status of the project after 12 weeks from the start (show all your calculations). Activity Predecessor Duration Weeks) A H C D E F 3 H A E. B D F.C 4) PV: EV: nAC: 8 12 S 18 1 8) SV: hj CV: SPI: DCPI: Cost per week (3) 1500 2000 4000 4000 a) Draw the Gantt chart of the complete project. Include all the dependencies and indicate the critical path on the chart. (7 points) b) Find THE CRITICAL PATH c) What is the planned duration of the complete project? (2 points) 2000 2500 3000 5000 . (3 points) (1 points) (1 points) (2 points) (2 points) (2 points) (2 points) What can you say about project performance in terms of budget and time? (2 points)
Step by Step Solution
3.48 Rating (151 Votes )
There are 3 Steps involved in it
Answer Lets break this down step by step Gantt Chart and Critical Path First well create a Gantt cha... View full answer

Get step-by-step solutions from verified subject matter experts