

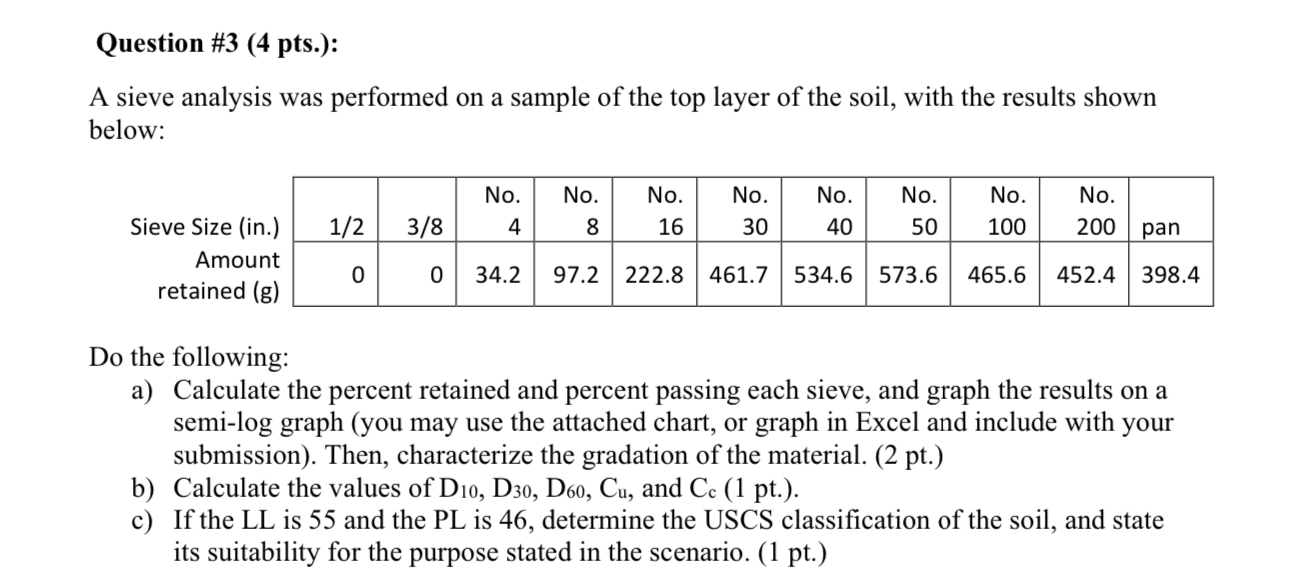
Question: Question # 3 ( 4 pts . ) : A sieve analysis was performed on a sample of the top layer of the soil, with
Question # pts:
A sieve analysis was performed on a sample of the top layer of the soil, with the results shown below:
Sieve Size in
Amount
retained
tablepan
Do the following:
a Calculate the percent retained and percent passing each sieve, and graph the results on a semilog graph you may use the attached chart, or graph in Excel and include with your submission Then, characterize the gradation of the material. pt
b Calculate the values of and pt
c If the LL is and the PL is determine the USCS classification of the soil, and state its suitability for the purpose stated in the scenario. pt
Step by Step Solution
There are 3 Steps involved in it
1 Expert Approved Answer
Step: 1 Unlock

Question Has Been Solved by an Expert!
Get step-by-step solutions from verified subject matter experts
Step: 2 Unlock
Step: 3 Unlock