

Question: Question 3 4 pts Table 14-5 The table represents a demand curve faced by a firm in a competitive Quantity Total Revenue $132 S143 S154
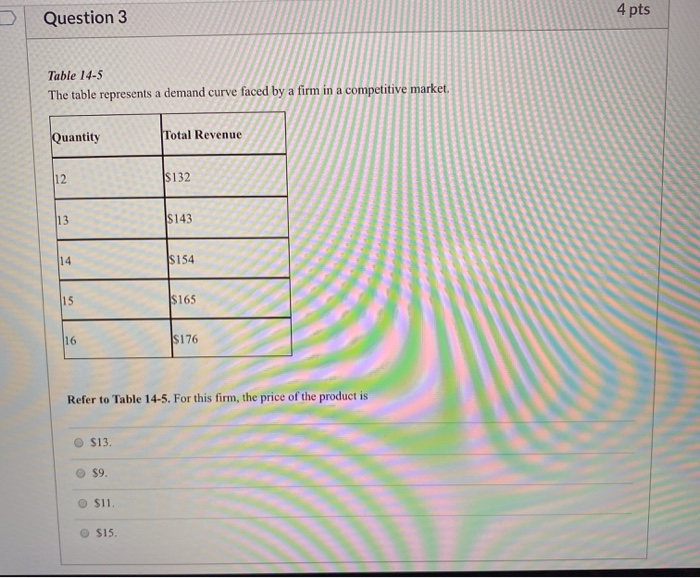
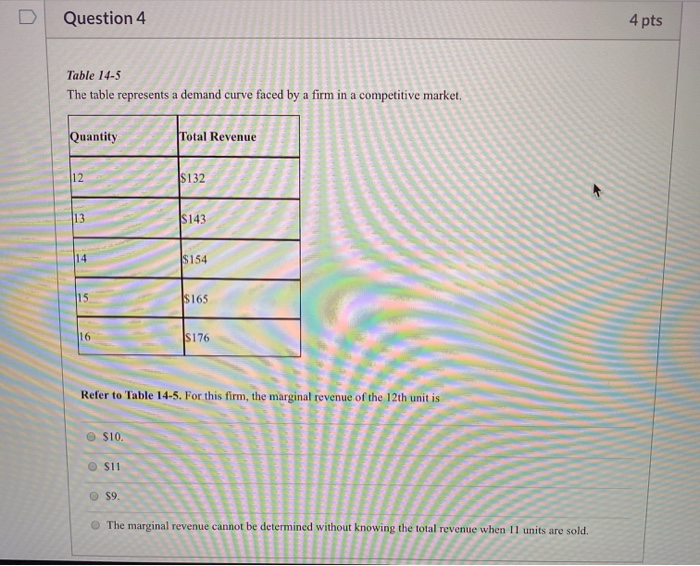
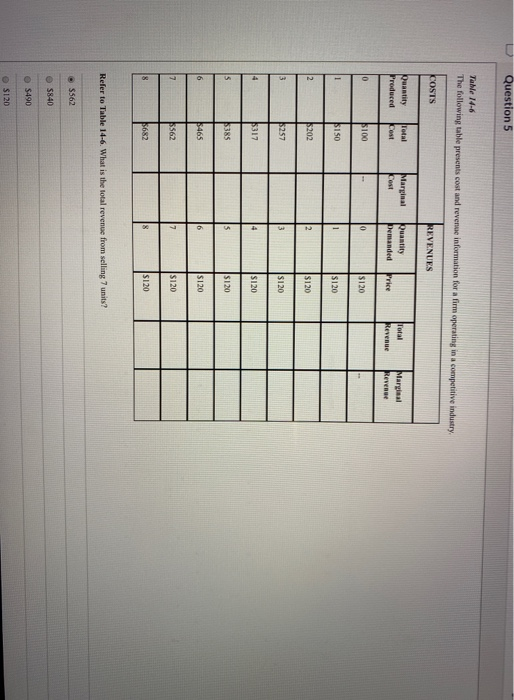
Question 3 4 pts Table 14-5 The table represents a demand curve faced by a firm in a competitive Quantity Total Revenue $132 S143 S154 $165 $176 Refer to Table 14-5. For this firm, the price of the product is $13. $9. $11 $15. D Question 4 4 pts Table 14-5 The table represents a demand curve faced by a firm in a competitive market. Quantity Total Revenue $154 $165 $176 Refer to Table 14-5. For this firm, the marginal revenue of the 12th unit is SIO The marginal revenue cannot be determined without knowing the total revenue when I units are sold. Question 5 Table 14-6 The following table presents cost and revenue information for a firm operating in a competitive industry COSTS REVENUES Total Quantity Produced Marginal est Quantity Demanded Marginal os $100 $150 $202 $257 $385 5465 3562 Refer to Table 14-6. What is the total revenue from selling 7 units? 5562 5840 5490 S120
Step by Step Solution
There are 3 Steps involved in it

Get step-by-step solutions from verified subject matter experts