

Question: Question 3) (40 points) Consider a transportation problem. There are a set of suppliers and a set of customers in a region. The customers
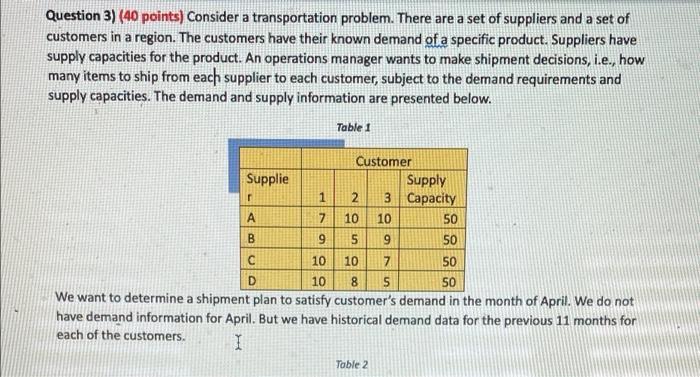
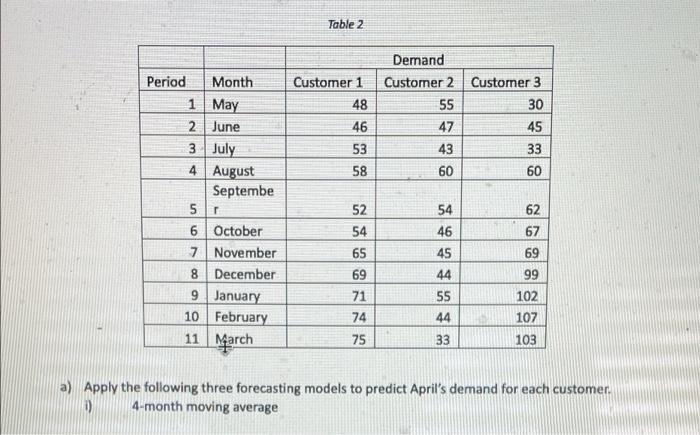
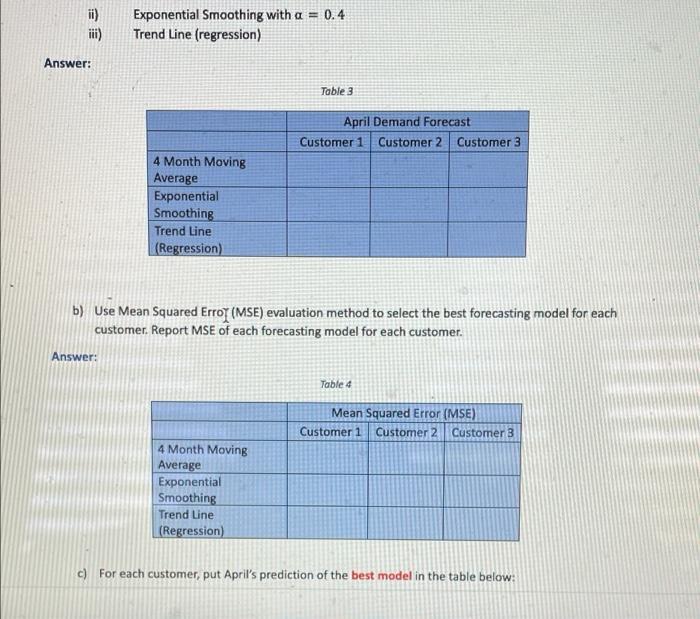
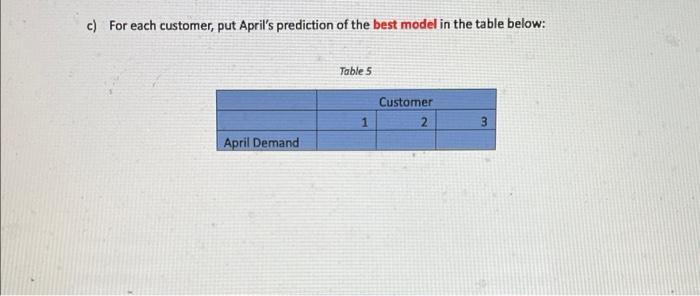

Question 3) (40 points) Consider a transportation problem. There are a set of suppliers and a set of customers in a region. The customers have their known demand of a specific product. Suppliers have supply capacities for the product. An operations manager wants to make shipment decisions, i.e., how many items to ship from each supplier to each customer, subject to the demand requirements and supply capacities. The demand and supply information are presented below. Supplie r A B 17 C Table 1 Customer 205000 10 3 Table 2 10 097 Supply Capacity 50 9 10 10 D 10 8 5 50 We want to determine a shipment plan to satisfy customer's demand in the month of April. We do not have demand information for April. But we have historical demand data for the previous 11 months for each of the customers. I 888 50 50 Period Month 1 May 2 June 3 July 4 August Septembe 5 6 October 7 November 8 December 9 January 10 February 11 March r Table 2 Customer 1 48 46 53 58 52 54 65 69 71 74 75 Demand Customer 2 Customer 3 30 45 33 60 55 47 43 60 54 44454 46 55 33 62 67 69 99 102 107 103 a) Apply the following three forecasting models to predict April's demand for each customer. D 4-month moving average ii) iii) Answer: Exponential Smoothing with a = 0.4 Trend Line (regression) Answer: 4 Month Moving Average Exponential Smoothing Trenc (Regression) Table 3 b) Use Mean Squared Erro (MSE) evaluation method to select the best forecasting model for each customer. Report MSE of each forecasting model for each customer. 4 Month Moving Average Exponential Smoothing Trend Line (Regression) April Demand Forecast Customer 1 Customer 2 Customer 3 Table 4 Mean Squared Error (MSE) Customer 1 Customer 2 Customer 3 c) For each customer, put April's prediction of the best model in the table below: c) For each customer, put April's prediction of the best model in the table below: April Demand Table 5 1 Customer 2 3 d) Use Excel solver to solve a transportation problem for the month of April based on cost and supply information of Table 1 and demand information of Table 5. (If you could not solve parts a, b, c, use demands of 60, 70, and 75 for customers 1, 2, and 3 respectively). You should make sure that demand of the customers is satisfied, and supply capacity of the suppliers is not violated. Can you solve this problem? What is the minimum transportation cost for this problem? What is the capacity utilization of supplier 3? Answer: Minimum transportation cost: Answer: Capacity utilization of supplier 3: All you answers should be placed in blue-box spaces of this word file. You will lose credit if you do not answer the questions in the blue-box area of this word file. For the mathematical models either use Word Equations, or write down the formulas on a paper, take a photo, and copy the photo in each box. You may also print this document, write your answers with a pen, and submit a scanned for high-quality photo) version. When submitting the assignment, you MUST upload the word file and an Excel Workbook, in which each question is solved in a separate worksheet. For the optimization problems, you must use the Excel solver. Question 3) (40 points) Consider a transportation problem. There are a set of suppliers and a set of customers in a region. The customers have their known demand of a specific product. Suppliers have supply capacities for the product. An operations manager wants to make shipment decisions, i.e., how many items to ship from each supplier to each customer, subject to the demand requirements and supply capacities. The demand and supply information are presented below. Supplie r A B 17 C Table 1 Customer 205000 10 3 Table 2 10 097 Supply Capacity 50 9 10 10 D 10 8 5 50 We want to determine a shipment plan to satisfy customer's demand in the month of April. We do not have demand information for April. But we have historical demand data for the previous 11 months for each of the customers. I 888 50 50 Period Month 1 May 2 June 3 July 4 August Septembe 5 6 October 7 November 8 December 9 January 10 February 11 March r Table 2 Customer 1 48 46 53 58 52 54 65 69 71 74 75 Demand Customer 2 Customer 3 30 45 33 60 55 47 43 60 54 44454 46 55 33 62 67 69 99 102 107 103 a) Apply the following three forecasting models to predict April's demand for each customer. D 4-month moving average ii) iii) Answer: Exponential Smoothing with a = 0.4 Trend Line (regression) Answer: 4 Month Moving Average Exponential Smoothing Trenc (Regression) Table 3 b) Use Mean Squared Erro (MSE) evaluation method to select the best forecasting model for each customer. Report MSE of each forecasting model for each customer. 4 Month Moving Average Exponential Smoothing Trend Line (Regression) April Demand Forecast Customer 1 Customer 2 Customer 3 Table 4 Mean Squared Error (MSE) Customer 1 Customer 2 Customer 3 c) For each customer, put April's prediction of the best model in the table below: c) For each customer, put April's prediction of the best model in the table below: April Demand Table 5 1 Customer 2 3 d) Use Excel solver to solve a transportation problem for the month of April based on cost and supply information of Table 1 and demand information of Table 5. (If you could not solve parts a, b, c, use demands of 60, 70, and 75 for customers 1, 2, and 3 respectively). You should make sure that demand of the customers is satisfied, and supply capacity of the suppliers is not violated. Can you solve this problem? What is the minimum transportation cost for this problem? What is the capacity utilization of supplier 3? Answer: Minimum transportation cost: Answer: Capacity utilization of supplier 3: All you answers should be placed in blue-box spaces of this word file. You will lose credit if you do not answer the questions in the blue-box area of this word file. For the mathematical models either use Word Equations, or write down the formulas on a paper, take a photo, and copy the photo in each box. You may also print this document, write your answers with a pen, and submit a scanned for high-quality photo) version. When submitting the assignment, you MUST upload the word file and an Excel Workbook, in which each question is solved in a separate worksheet. For the optimization problems, you must use the Excel solver. Question 3) (40 points) Consider a transportation problem. There are a set of suppliers and a set of customers in a region. The customers have their known demand of a specific product. Suppliers have supply capacities for the product. An operations manager wants to make shipment decisions, i.e., how many items to ship from each supplier to each customer, subject to the demand requirements and supply capacities. The demand and supply information are presented below. Supplie r A B 17 C Table 1 Customer 205000 10 3 Table 2 10 097 Supply Capacity 50 9 10 10 D 10 8 5 50 We want to determine a shipment plan to satisfy customer's demand in the month of April. We do not have demand information for April. But we have historical demand data for the previous 11 months for each of the customers. I 888 50 50 Period Month 1 May 2 June 3 July 4 August Septembe 5 6 October 7 November 8 December 9 January 10 February 11 March r Table 2 Customer 1 48 46 53 58 52 54 65 69 71 74 75 Demand Customer 2 Customer 3 30 45 33 60 55 47 43 60 54 44454 46 55 33 62 67 69 99 102 107 103 a) Apply the following three forecasting models to predict April's demand for each customer. D 4-month moving average ii) iii) Answer: Exponential Smoothing with a = 0.4 Trend Line (regression) Answer: 4 Month Moving Average Exponential Smoothing Trenc (Regression) Table 3 b) Use Mean Squared Erro (MSE) evaluation method to select the best forecasting model for each customer. Report MSE of each forecasting model for each customer. 4 Month Moving Average Exponential Smoothing Trend Line (Regression) April Demand Forecast Customer 1 Customer 2 Customer 3 Table 4 Mean Squared Error (MSE) Customer 1 Customer 2 Customer 3 c) For each customer, put April's prediction of the best model in the table below: c) For each customer, put April's prediction of the best model in the table below: April Demand Table 5 1 Customer 2 3 d) Use Excel solver to solve a transportation problem for the month of April based on cost and supply information of Table 1 and demand information of Table 5. (If you could not solve parts a, b, c, use demands of 60, 70, and 75 for customers 1, 2, and 3 respectively). You should make sure that demand of the customers is satisfied, and supply capacity of the suppliers is not violated. Can you solve this problem? What is the minimum transportation cost for this problem? What is the capacity utilization of supplier 3? Answer: Minimum transportation cost: Answer: Capacity utilization of supplier 3: All you answers should be placed in blue-box spaces of this word file. You will lose credit if you do not answer the questions in the blue-box area of this word file. For the mathematical models either use Word Equations, or write down the formulas on a paper, take a photo, and copy the photo in each box. You may also print this document, write your answers with a pen, and submit a scanned for high-quality photo) version. When submitting the assignment, you MUST upload the word file and an Excel Workbook, in which each question is solved in a separate worksheet. For the optimization problems, you must use the Excel solver. Question 3) (40 points) Consider a transportation problem. There are a set of suppliers and a set of customers in a region. The customers have their known demand of a specific product. Suppliers have supply capacities for the product. An operations manager wants to make shipment decisions, i.e., how many items to ship from each supplier to each customer, subject to the demand requirements and supply capacities. The demand and supply information are presented below. Supplie r A B 17 C Table 1 Customer 205000 10 3 Table 2 10 097 Supply Capacity 50 9 10 10 D 10 8 5 50 We want to determine a shipment plan to satisfy customer's demand in the month of April. We do not have demand information for April. But we have historical demand data for the previous 11 months for each of the customers. I 888 50 50 Period Month 1 May 2 June 3 July 4 August Septembe 5 6 October 7 November 8 December 9 January 10 February 11 March r Table 2 Customer 1 48 46 53 58 52 54 65 69 71 74 75 Demand Customer 2 Customer 3 30 45 33 60 55 47 43 60 54 44454 46 55 33 62 67 69 99 102 107 103 a) Apply the following three forecasting models to predict April's demand for each customer. D 4-month moving average ii) iii) Answer: Exponential Smoothing with a = 0.4 Trend Line (regression) Answer: 4 Month Moving Average Exponential Smoothing Trenc (Regression) Table 3 b) Use Mean Squared Erro (MSE) evaluation method to select the best forecasting model for each customer. Report MSE of each forecasting model for each customer. 4 Month Moving Average Exponential Smoothing Trend Line (Regression) April Demand Forecast Customer 1 Customer 2 Customer 3 Table 4 Mean Squared Error (MSE) Customer 1 Customer 2 Customer 3 c) For each customer, put April's prediction of the best model in the table below: c) For each customer, put April's prediction of the best model in the table below: April Demand Table 5 1 Customer 2 3 d) Use Excel solver to solve a transportation problem for the month of April based on cost and supply information of Table 1 and demand information of Table 5. (If you could not solve parts a, b, c, use demands of 60, 70, and 75 for customers 1, 2, and 3 respectively). You should make sure that demand of the customers is satisfied, and supply capacity of the suppliers is not violated. Can you solve this problem? What is the minimum transportation cost for this problem? What is the capacity utilization of supplier 3? Answer: Minimum transportation cost: Answer: Capacity utilization of supplier 3: All you answers should be placed in blue-box spaces of this word file. You will lose credit if you do not answer the questions in the blue-box area of this word file. For the mathematical models either use Word Equations, or write down the formulas on a paper, take a photo, and copy the photo in each box. You may also print this document, write your answers with a pen, and submit a scanned for high-quality photo) version. When submitting the assignment, you MUST upload the word file and an Excel Workbook, in which each question is solved in a separate worksheet. For the optimization problems, you must use the Excel solver.
Step by Step Solution
3.34 Rating (148 Votes )
There are 3 Steps involved in it

Get step-by-step solutions from verified subject matter experts