

Question: Question 3 [8 points) The contingency table below (Table 1) contains data about hair- and eye colour for N = 592 students. (You can think
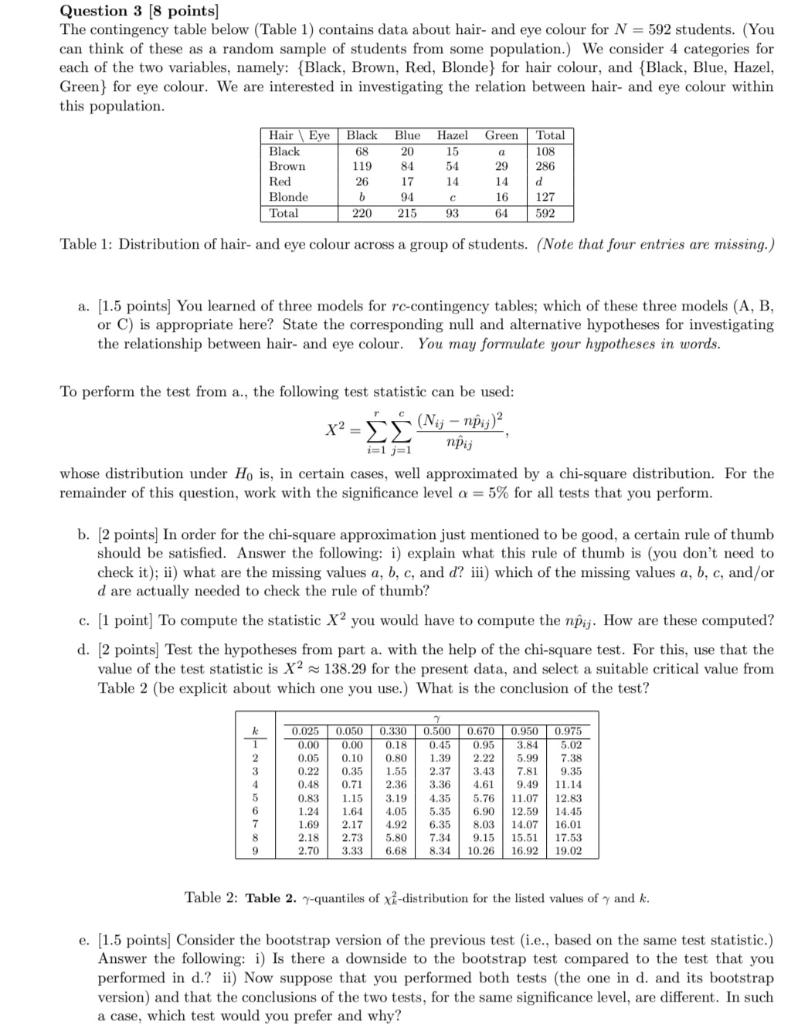
Question 3 [8 points) The contingency table below (Table 1) contains data about hair- and eye colour for N = 592 students. (You can think of these as a random sample of students from some population.) We consider 4 categories for each of the two variables, namely: {Black, Brown, Red, Blonde) for hair colour, and {Black, Blue, Hazel, Green} for eye colour. We are interested in investigating the relation between hair- and eye colour within this population. Hair Eye Black Blue Hazel Green Total Black 108 Brown Red Blonde Total a 29 68 119 26 b 220 20 84 17 94 215 15 54 14 93 286 d 127 592 16 64 Table 1: Distribution of hair- and eye colour across a group of students. (Note that four entries are missing.) a. [1.5 points) You learned of three models for re-contingency tables; which of these three models (A, B, or C) is appropriate here? State the corresponding null and alternative hypotheses for investigating the relationship between hair- and eye colour. You may formulate your hypotheses in words. To perform the test from a., the following test statistic can be used: X2= (Nij npij)? whose distribution under Ho is, in certain cases, well approximated by a chi-square distribution. For the remainder of this question, work with the significance level a = 5% for all tests that you perform. b. [2 points. In order for the chi-square approximation just mentioned to be good, a certain rule of thumb should be satisfied. Answer the following: i) explain what this rule of thumb is (you don't need to check it); ii) what are the missing values a, b, c, and d? iii) which of the missing values a, b, c, and/or d are actually needed to check the rule of thumb? c. [1 point) To compute the statistic Xyou would have to compute the nipij. How are these computed? d. [2 points) Test the hypotheses from part a. with the help of the chi-square test. For this, use that the value of the test statistic is X2 138.29 for the present data, and select a suitable critical value from Table 2 (be explicit about which one you use.) What is the conclusion of the test? R 0.18 2 3 4 5 6 7 8 9 0.025 0.050 0.00 0.00 0.05 0.10 0.22 0.35 0.48 0.71 0.83 1.15 1.24 1.64 1.69 2.17 2.18 2.73 2.70 7 0.330 0.500 0.45 0.80 1.39 1.55 2.37 2.36 3.36 3.19 4.35 4,05 5.35 4.92 6.35 5.80 7.34 6.68 8.34 0.670 0.95 2.22 3.43 4.61 5.76 6.90 8.03 9.15 10.26 0.950 3.84 5.99 7.81 9.49 11.07 12.59 14.07 15.51 16.92 0.975 5.02 7.38 9.35 11.14 12.83 14.45 16.01 17.53 19.02 Table 2: Table 2. 7-quantiles of x-distribution for the listed values of y and k. e. [1.5 points] Consider the bootstrap version of the previous test (i.e., based on the same test statistic.) Answer the following: i) Is there a downside to the bootstrap test compared to the test that you performed in d.? ii) Now suppose that you performed both tests (the one in d. and its bootstrap version) and that the conclusions of the two tests, for the same significance level, are different. In such a case, which test would you prefer and why? Question 3 [8 points) The contingency table below (Table 1) contains data about hair- and eye colour for N = 592 students. (You can think of these as a random sample of students from some population.) We consider 4 categories for each of the two variables, namely: {Black, Brown, Red, Blonde) for hair colour, and {Black, Blue, Hazel, Green} for eye colour. We are interested in investigating the relation between hair- and eye colour within this population. Hair Eye Black Blue Hazel Green Total Black 108 Brown Red Blonde Total a 29 68 119 26 b 220 20 84 17 94 215 15 54 14 93 286 d 127 592 16 64 Table 1: Distribution of hair- and eye colour across a group of students. (Note that four entries are missing.) a. [1.5 points) You learned of three models for re-contingency tables; which of these three models (A, B, or C) is appropriate here? State the corresponding null and alternative hypotheses for investigating the relationship between hair- and eye colour. You may formulate your hypotheses in words. To perform the test from a., the following test statistic can be used: X2= (Nij npij)? whose distribution under Ho is, in certain cases, well approximated by a chi-square distribution. For the remainder of this question, work with the significance level a = 5% for all tests that you perform. b. [2 points. In order for the chi-square approximation just mentioned to be good, a certain rule of thumb should be satisfied. Answer the following: i) explain what this rule of thumb is (you don't need to check it); ii) what are the missing values a, b, c, and d? iii) which of the missing values a, b, c, and/or d are actually needed to check the rule of thumb? c. [1 point) To compute the statistic Xyou would have to compute the nipij. How are these computed? d. [2 points) Test the hypotheses from part a. with the help of the chi-square test. For this, use that the value of the test statistic is X2 138.29 for the present data, and select a suitable critical value from Table 2 (be explicit about which one you use.) What is the conclusion of the test? R 0.18 2 3 4 5 6 7 8 9 0.025 0.050 0.00 0.00 0.05 0.10 0.22 0.35 0.48 0.71 0.83 1.15 1.24 1.64 1.69 2.17 2.18 2.73 2.70 7 0.330 0.500 0.45 0.80 1.39 1.55 2.37 2.36 3.36 3.19 4.35 4,05 5.35 4.92 6.35 5.80 7.34 6.68 8.34 0.670 0.95 2.22 3.43 4.61 5.76 6.90 8.03 9.15 10.26 0.950 3.84 5.99 7.81 9.49 11.07 12.59 14.07 15.51 16.92 0.975 5.02 7.38 9.35 11.14 12.83 14.45 16.01 17.53 19.02 Table 2: Table 2. 7-quantiles of x-distribution for the listed values of y and k. e. [1.5 points] Consider the bootstrap version of the previous test (i.e., based on the same test statistic.) Answer the following: i) Is there a downside to the bootstrap test compared to the test that you performed in d.? ii) Now suppose that you performed both tests (the one in d. and its bootstrap version) and that the conclusions of the two tests, for the same significance level, are different. In such a case, which test would you prefer and why
Step by Step Solution
There are 3 Steps involved in it

Get step-by-step solutions from verified subject matter experts