

Question: Question 3 a ) Figure 1 shows a sand column, drawn to scale, with cross - sectional area A = 1 m 2 through which
Question
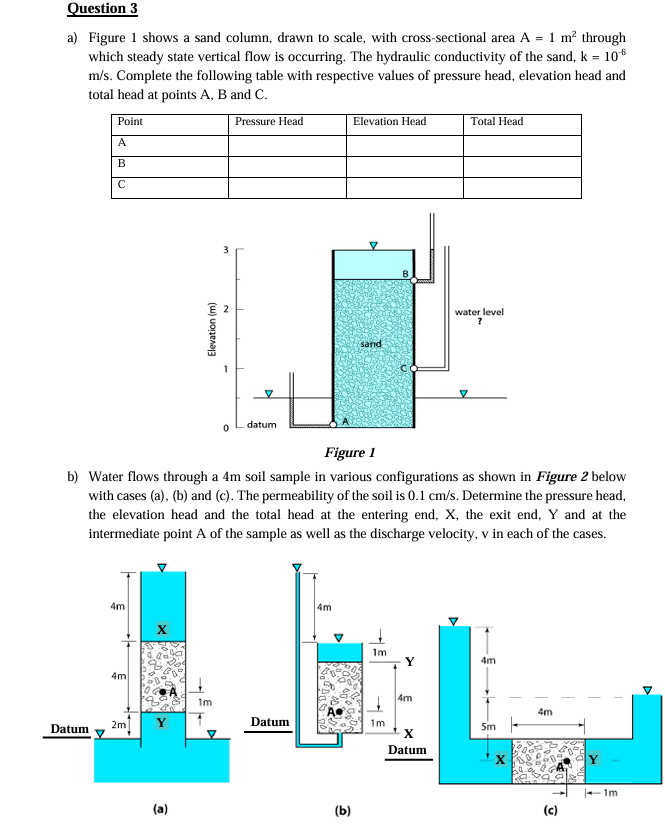
a Figure shows a sand column, drawn to scale, with crosssectional area through
which steady state vertical flow is occurring. The hydraulic conductivity of the sand,
Complete the following table with respective values of pressure head, elevation head and
total head at points and C
rigutes
b Water flows through a m soil sample in various configurations as shown in Figure below
with cases ab and c The permeability of the soil is Determine the pressure head,
the elevation head and the total head at the entering end, X the exit end, Y and at the
intermediate point A of the sample as well as the discharge velocity, in each of the cases.
a
Datum
c
Step by Step Solution
There are 3 Steps involved in it
1 Expert Approved Answer
Step: 1 Unlock

Question Has Been Solved by an Expert!
Get step-by-step solutions from verified subject matter experts
Step: 2 Unlock
Step: 3 Unlock