

a) The graph below shows the free-energy changes associated with each step of glucose metabolism. Describe the
Question:
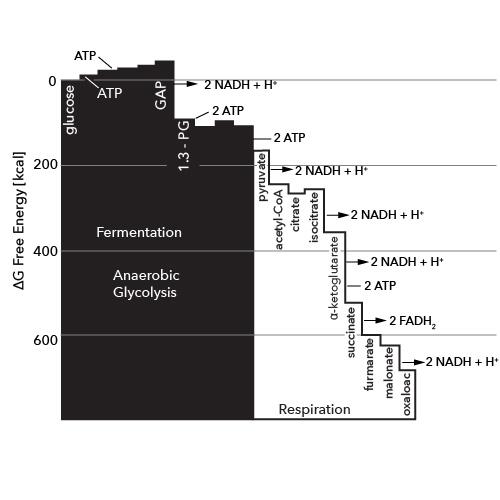
a) The graph below shows the free-energy changes associated with each step of glucose metabolism. Describe the difference in efficiency of free-energy extraction between anaerobic and aerobic organisms. Explain what each horizontal step on the graph represents. Explain the need for multiple steps.
b) Groups of identical cells were analyzed for glucose consumption under aerobic and anaerobic conditions. The results are shown in the table below. Additional analysis showed that cell division and all other processes occurred at the same rate in both groups; only the rate of glucose consumption was found to differ. Explain the high rate of glucose consumption in the absence of oxygen and the low rate in the presence of oxygen.
| Oxygen absent | Oxygen present | |
| Rate of glucose consumption (μmol/min) | 96 | 22 |
Expert Answer:
a As we know that this respiration occurs in every living creature whether animal or plant In general respiration in living things can be divided into 2 types namely aerobic respiration and anaerobic ... View the full answer


Financial Algebra advanced algebra with financial applications
ISBN: 978-0538449670
1st edition
Authors: Robert K. Gerver
