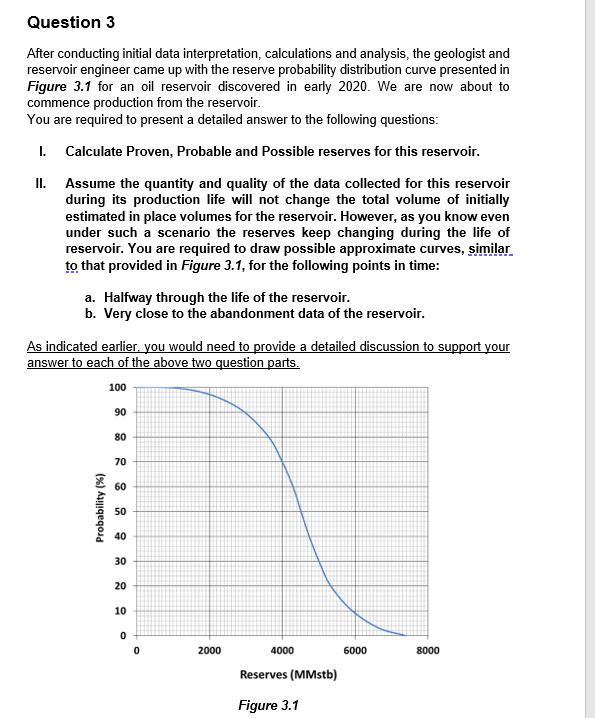
Question: Question 3 After conducting initial data interpretation, calculations and analysis, the geologist and reservoir engineer came up with the reserve probability distribution curve presented in

Question 3 After conducting initial data

Question 3 After conducting initial data interpretation, calculations and analysis, the geologist and reservoir engineer came up with the reserve probability distribution curve presented in Figure 3.1 for an oil reservoir discovered in early 2020. We are now about to commence production from the reservoir. You are required to present a detailed answer to the following questions: 1. Calculate Proven, Probable and possible reserves for this reservoir. II. Assume the quantity and quality of the data collected for this reservoir during its production life will not change the total volume of initially estimated in place volumes for the reservoir. However, as you know even under such a scenario the reserves keep changing during the life of reservoir. You are required to draw possible approximate curves, similar to that provided in Figure 3.1, for the following points in time: a. Halfway through the life of the reservoir. b. Very close to the abandonment data of the reservoir. As indicated earlier, you would need to provide a detailed discussion to support your answer to each of the above two question parts. 100 90 80 70 60 Probability (%) 50 40 30 20 10 0 2000 4000 6000 8000 Reserves (MMstb) Figure 3.1

Step by Step Solution

There are 3 Steps involved in it

1 Expert Approved Answer
Step: 1 Unlock blur-text-image
Question Has Been Solved by an Expert!

Get step-by-step solutions from verified subject matter experts

Step: 2 Unlock
Step: 3 Unlock

Students Have Also Explored These Related General Management Questions!