

Question: Question 3 Alcohol & Coordination Study Alcohol & Coordination Study 18 16 14 12 Motor 10 Coordination 8 ONA 6 8 10 12 14 16
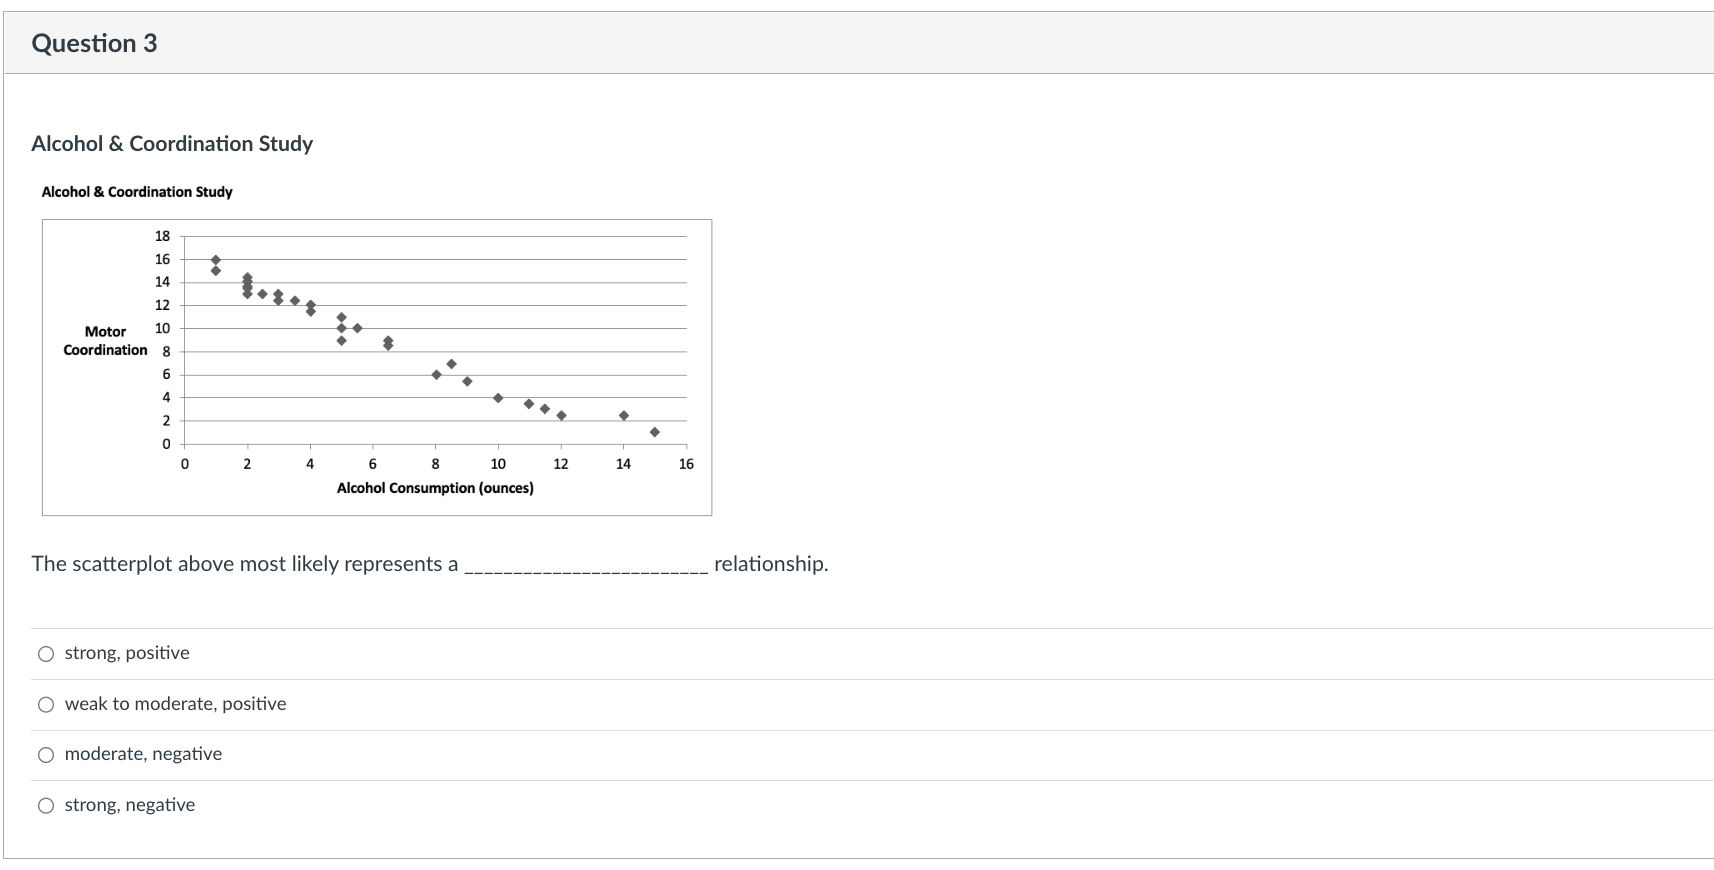
Question 3 Alcohol & Coordination Study Alcohol & Coordination Study 18 16 14 12 Motor 10 Coordination 8 ONA 6 8 10 12 14 16 Alcohol Consumption (ounces) The scatterplot above most likely represents a relationship. O strong, positive O weak to moderate, positive O moderate, negative O strong, negative
Step by Step Solution
There are 3 Steps involved in it
1 Expert Approved Answer
Step: 1 Unlock

Question Has Been Solved by an Expert!
Get step-by-step solutions from verified subject matter experts
Step: 2 Unlock
Step: 3 Unlock