

Question: Question: 3. As we have seen in class, hypothesis testing, and confidence intervals are the most common inferential tools used in statistics. Imagine that you
Question:
3. As we have seen in class, hypothesis testing, and confidence intervals are the most common inferential tools used in statistics. Imagine that you have been tasked with designing an experiment to determine reliably if a patient should be diagnosed with diabetes based on their blood test results. Make a short outline of your experiment, including all the following:
a. A detailed discussion of your experimental design. Detailed experimental design should include the type of experiment, how you chose your sample size, what data is being collected, and how you would collect that data.
b. How is randomization used in your sampling or assignment strategy? Remember to discuss how you would randomize for sampling and assignment, what type of randomization are you using?
c. The type of inferential test utilized in your experiment. Include type of test used, number of tails, and a justification for this choice.
d. A formal statement of the null and alternative hypothesis for your test. Make sure to include correct statistical notation for the formal null and alternative, do not just state this in words.
e. A confidence interval for estimating the parameter in your test. State and discuss your chosen confidence level, why this is appropriate, and interpret the lower and upper limits.
d. An interpretation of your p-value and confidence interval, including what they mean in the context of your experimental design. Answer each part below. State your significance level, interpret your p-value, and make a decision on the null.
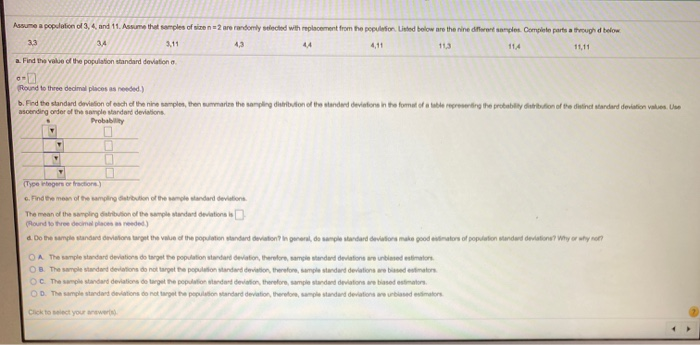
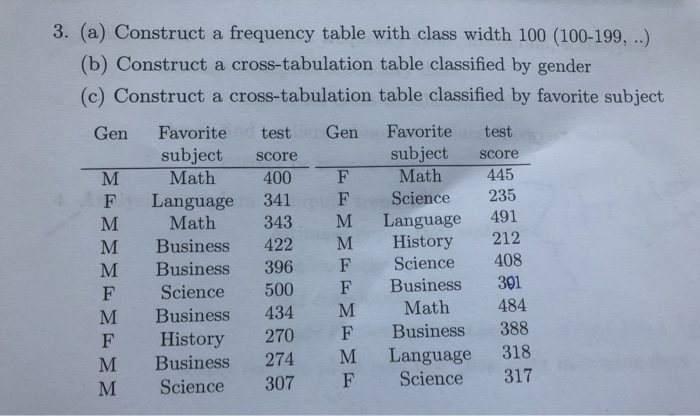
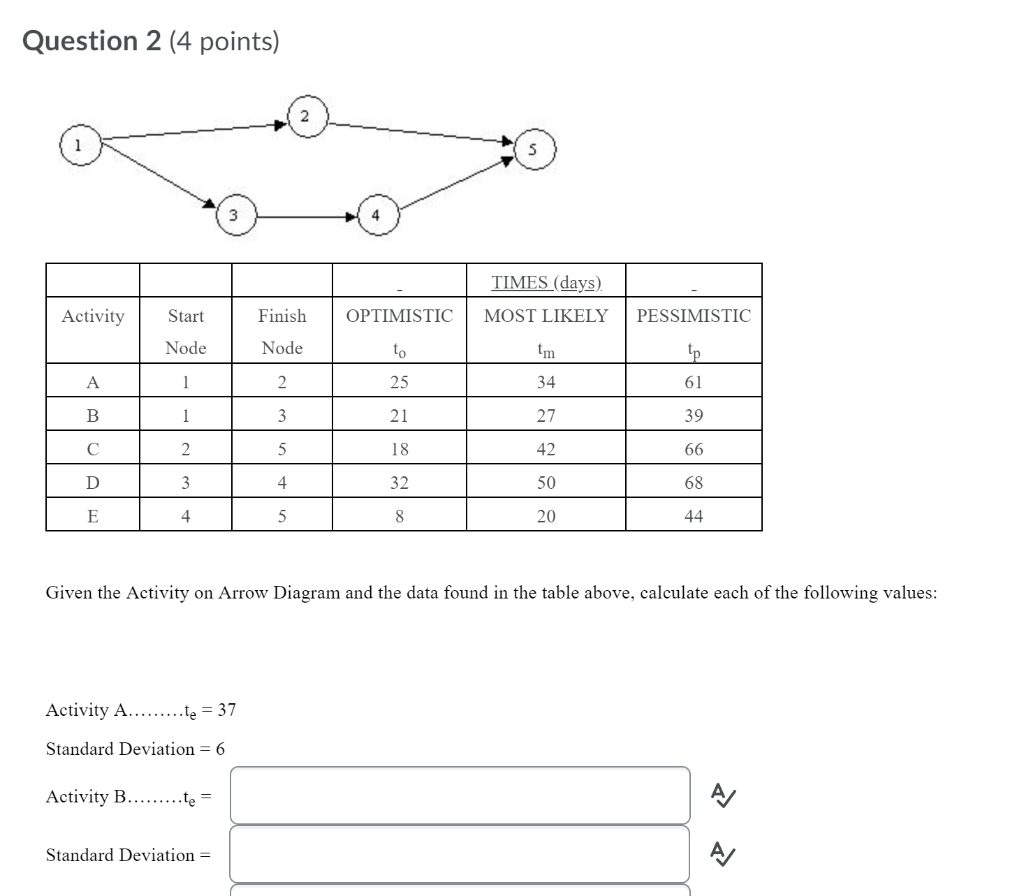
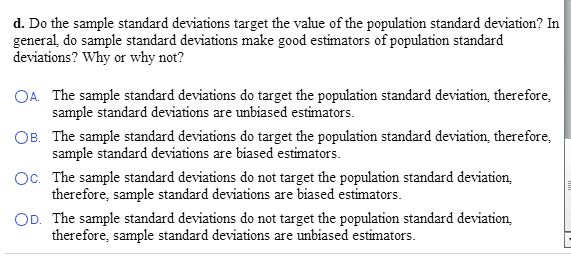
hasumo a population of 3, 4. and 11. Assume that samples of size n =2 are randomly selected with replacement from the population Listed below are the nine different samples. Comphin parts s through d below 3.3 3.41 4,3 44 4,11 11.3 114 11.11 a. Find the volvo of the population standard deviation n "Round to three decimal places as needed. ) b. Find the standard division of such of the nine samples, from summarize the sampling distribution of the slandered deviations in the formal of a table roger sending the probability chiritation of the difinal standard deviation voting, Line asounding order of The simple standard deviations. Probability G. Find the mann of the sampling distribution of the sample standard deviations. The mean of the sampling datribution of the sample standard deviations 's [Pleural to three decimal places as reeded) d. Do the simple glandand divisiona target the value of the population standard deviation ? In general, do sample whatdard deviations make good evisions of population wunderd deviations? Why or why not? C A. The simple standard deviations do target the population standard deviation, therebre, sangie shinded deviations are unbiased estimators. OB. The sample standard dedations do not target the population standard devision, Barslove, simple standard deviations are biased aviator. CC. The sample standard deviations do target the population standard dedation, farshore, sample sizedand deviation in based ssimaion. O D. The sample stardied orelations do not target the population standard deviation, thereion, sample standard deviations are unbiased ssimators Click to select your mewere).3. (a) Construct a frequency table with class width 100 (100-199, ..) (b) Construct a cross-tabulation table classified by gender (c) Construct a cross-tabulation table classified by favorite subject Gen Favorite test Gen Favorite test subject score subject score M Math 400 F Math 445 F Language 341 Science 235 M Math 343 M Language 491 M Business 422 M History 212 M Business 396 Science 408 F Science 500 Business 301 M Business 434 M Math 484 F History 270 F Business 388 M Business 274 M Language 318 M Science 307 F Science 317Question 2 (4 points) TIMES (days) Activity Start Finish OPTIMISTIC MOST LIKELY PESSIMISTIC Node Node to m Ip A 1 2 25 34 61 B 1 3 21 27 39 C 2 5 18 42 66 D 3 4 32 50 58 E 4 5 8 20 44 Given the Activity on Arrow Diagram and the data found in the table above, calculate each of the following values: Activity A.........te = 37 Standard Deviation = 6 Activity B.........te = A/ Standard Deviation = A/d. Do the sample standard deviations target the value of the population standard deviation? In general, do sample standard deviations make good estimators of population standard deviations? Why or why not? OA. The sample standard deviations do target the population standard deviation, therefore, sample standard deviations are unbiased estimators. OB. The sample standard deviations do target the population standard deviation, therefore, sample standard deviations are biased estimators. Oc. The sample standard deviations do not target the population standard deviation, therefore, sample standard deviations are biased estimators. OD. The sample standard deviations do not target the population standard deviation, therefore, sample standard deviations are unbiased estimators
Step by Step Solution
There are 3 Steps involved in it

Get step-by-step solutions from verified subject matter experts