

Question: Question 3 Consider the following (normalized) data on weekly light bulb sales at a warehouse over the last six months. Currently, t=26 (end of...): Week
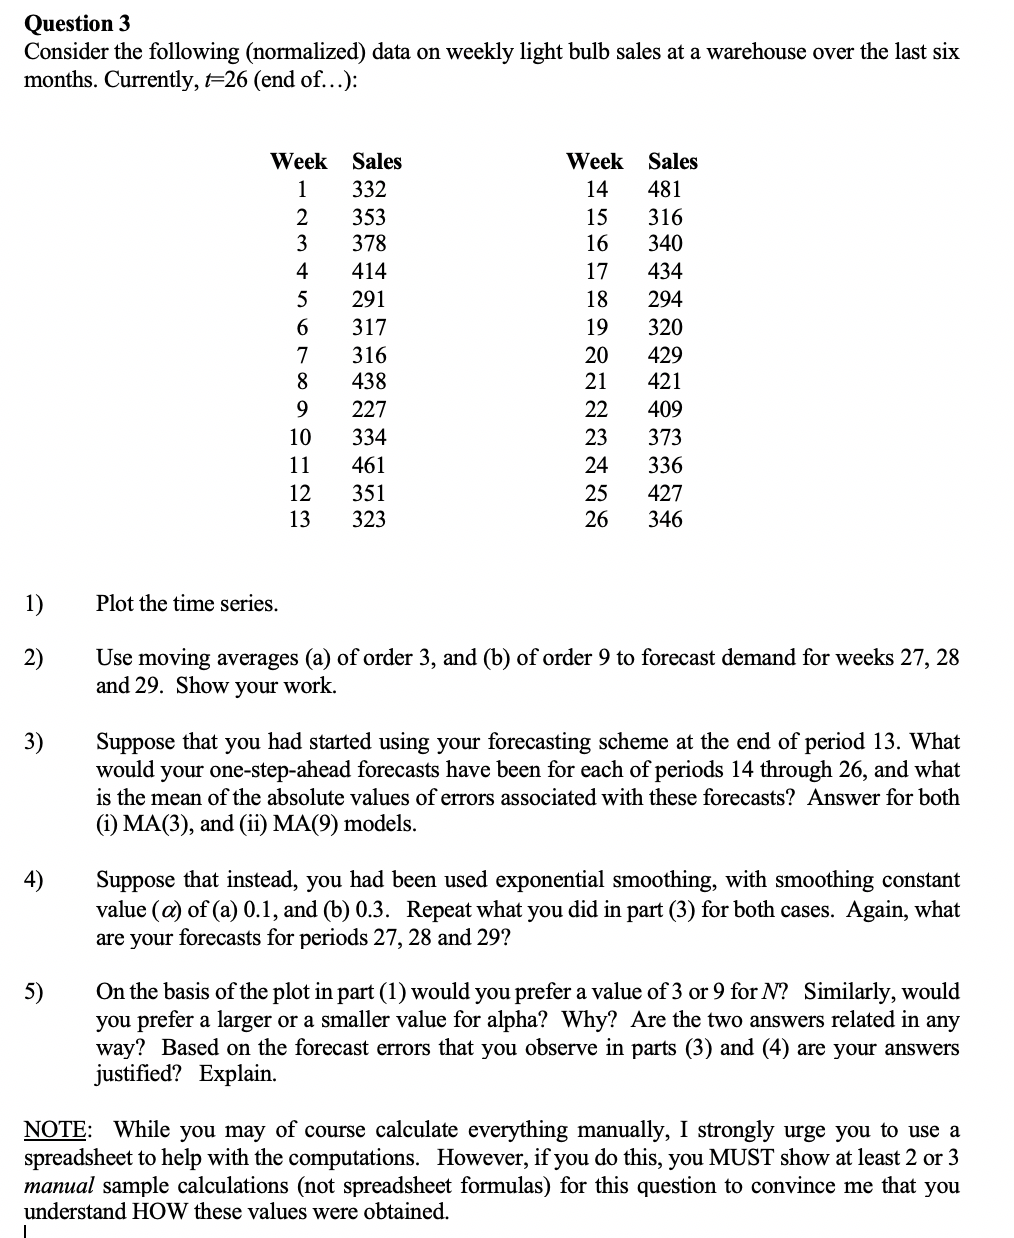
Question 3 Consider the following (normalized) data on weekly light bulb sales at a warehouse over the last six months. Currently, t=26 (end of...): Week Sales 332 353 378 414 291 317 Week Sales 14 481 15 316 340 434 294 320 429 421 409 373 336 427 346 316 438 227 334 461 351 323 9 1) Plot the time series. 2) Use moving averages (a) of order 3, and (b) of order 9 to forecast demand for weeks 27, 28 and 29. Show your work. 3) Suppose that you had started using your forecasting scheme at the end of period 13. What would your one-step-ahead forecasts have been for each of periods 14 through 26, and what is the mean of the absolute values of errors associated with these forecasts? Answer for both (i) MA(3), and (ii) MA(9) models. 4) Suppose that instead, you had been used exponential smoothing, with smoothing constant value (a) of (a) 0.1, and (b) 0.3. Repeat what you did in part (3) for both cases. Again, what are your forecasts for periods 27, 28 and 29? 5) On the basis of the plot in part (1) would you prefer a value of 3 or 9 for N? Similarly, would you prefer a larger or a smaller value for alpha? Why? Are the two answers related in any way? Based on the forecast errors that you observe in parts (3) and (4) are your answers justified? Explain. NOTE: While you may of course calculate everything manually, I strongly urge you to use a spreadsheet to help with the computations. However, if you do this, you MUST show at least 2 or 3 manual sample calculations (not spreadsheet formulas) for this question to convince me that you understand HOW these values were obtained. Question 3 Consider the following (normalized) data on weekly light bulb sales at a warehouse over the last six months. Currently, t=26 (end of...): Week Sales 332 353 378 414 291 317 Week Sales 14 481 15 316 340 434 294 320 429 421 409 373 336 427 346 316 438 227 334 461 351 323 9 1) Plot the time series. 2) Use moving averages (a) of order 3, and (b) of order 9 to forecast demand for weeks 27, 28 and 29. Show your work. 3) Suppose that you had started using your forecasting scheme at the end of period 13. What would your one-step-ahead forecasts have been for each of periods 14 through 26, and what is the mean of the absolute values of errors associated with these forecasts? Answer for both (i) MA(3), and (ii) MA(9) models. 4) Suppose that instead, you had been used exponential smoothing, with smoothing constant value (a) of (a) 0.1, and (b) 0.3. Repeat what you did in part (3) for both cases. Again, what are your forecasts for periods 27, 28 and 29? 5) On the basis of the plot in part (1) would you prefer a value of 3 or 9 for N? Similarly, would you prefer a larger or a smaller value for alpha? Why? Are the two answers related in any way? Based on the forecast errors that you observe in parts (3) and (4) are your answers justified? Explain. NOTE: While you may of course calculate everything manually, I strongly urge you to use a spreadsheet to help with the computations. However, if you do this, you MUST show at least 2 or 3 manual sample calculations (not spreadsheet formulas) for this question to convince me that you understand HOW these values were obtained
Step by Step Solution
There are 3 Steps involved in it

Get step-by-step solutions from verified subject matter experts