

Question: Question 3 Consider the two (excess returns) index-model regression results for Stocks A and B, reported in Table 1. The risk-free rate of return over
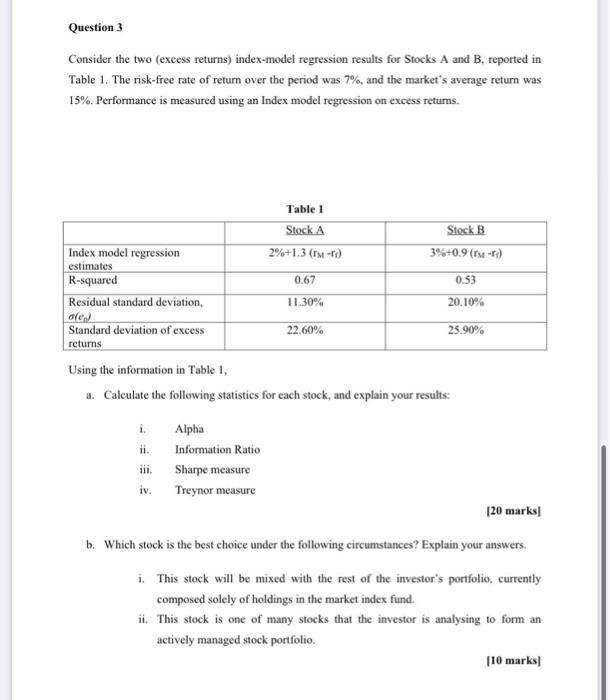
Question 3 Consider the two (excess returns) index-model regression results for Stocks A and B, reported in Table 1. The risk-free rate of return over the period was 7%, and the market's average return was 15%. Performance is measured using an Index model regression on excess returns. Table 1 Stock A 2%+1.3 (TM Stock B 3%+0.9 (-) 0.67 0.53 Index model regression estimates R-squared Residual standard deviation, ale Standard deviation of excess returns 11.30% 20.10% 22.60% 25.90% Using the information in Table 1, a. Calculate the following statistics for each stock, and explain your results: i. Alpha Information Ratio Sharpe measure iv. Treynor measure [20 marks! b. Which stock is the best choice under the following circumstances? Explain your answers. i. This stock will be mixed with the rest of the investor's portfolio, currently composed solely of holdings in the market index fund. ii. This stock is one of many stocks that the investor is analysing to form an actively managed stock portfolio. 110 marks)
Step by Step Solution
There are 3 Steps involved in it

Get step-by-step solutions from verified subject matter experts