

Question: Question 3 Here are comparative statement data for Duke Company and Lord Company, two competitors. All balance sheet data are as of December 31, 2020,
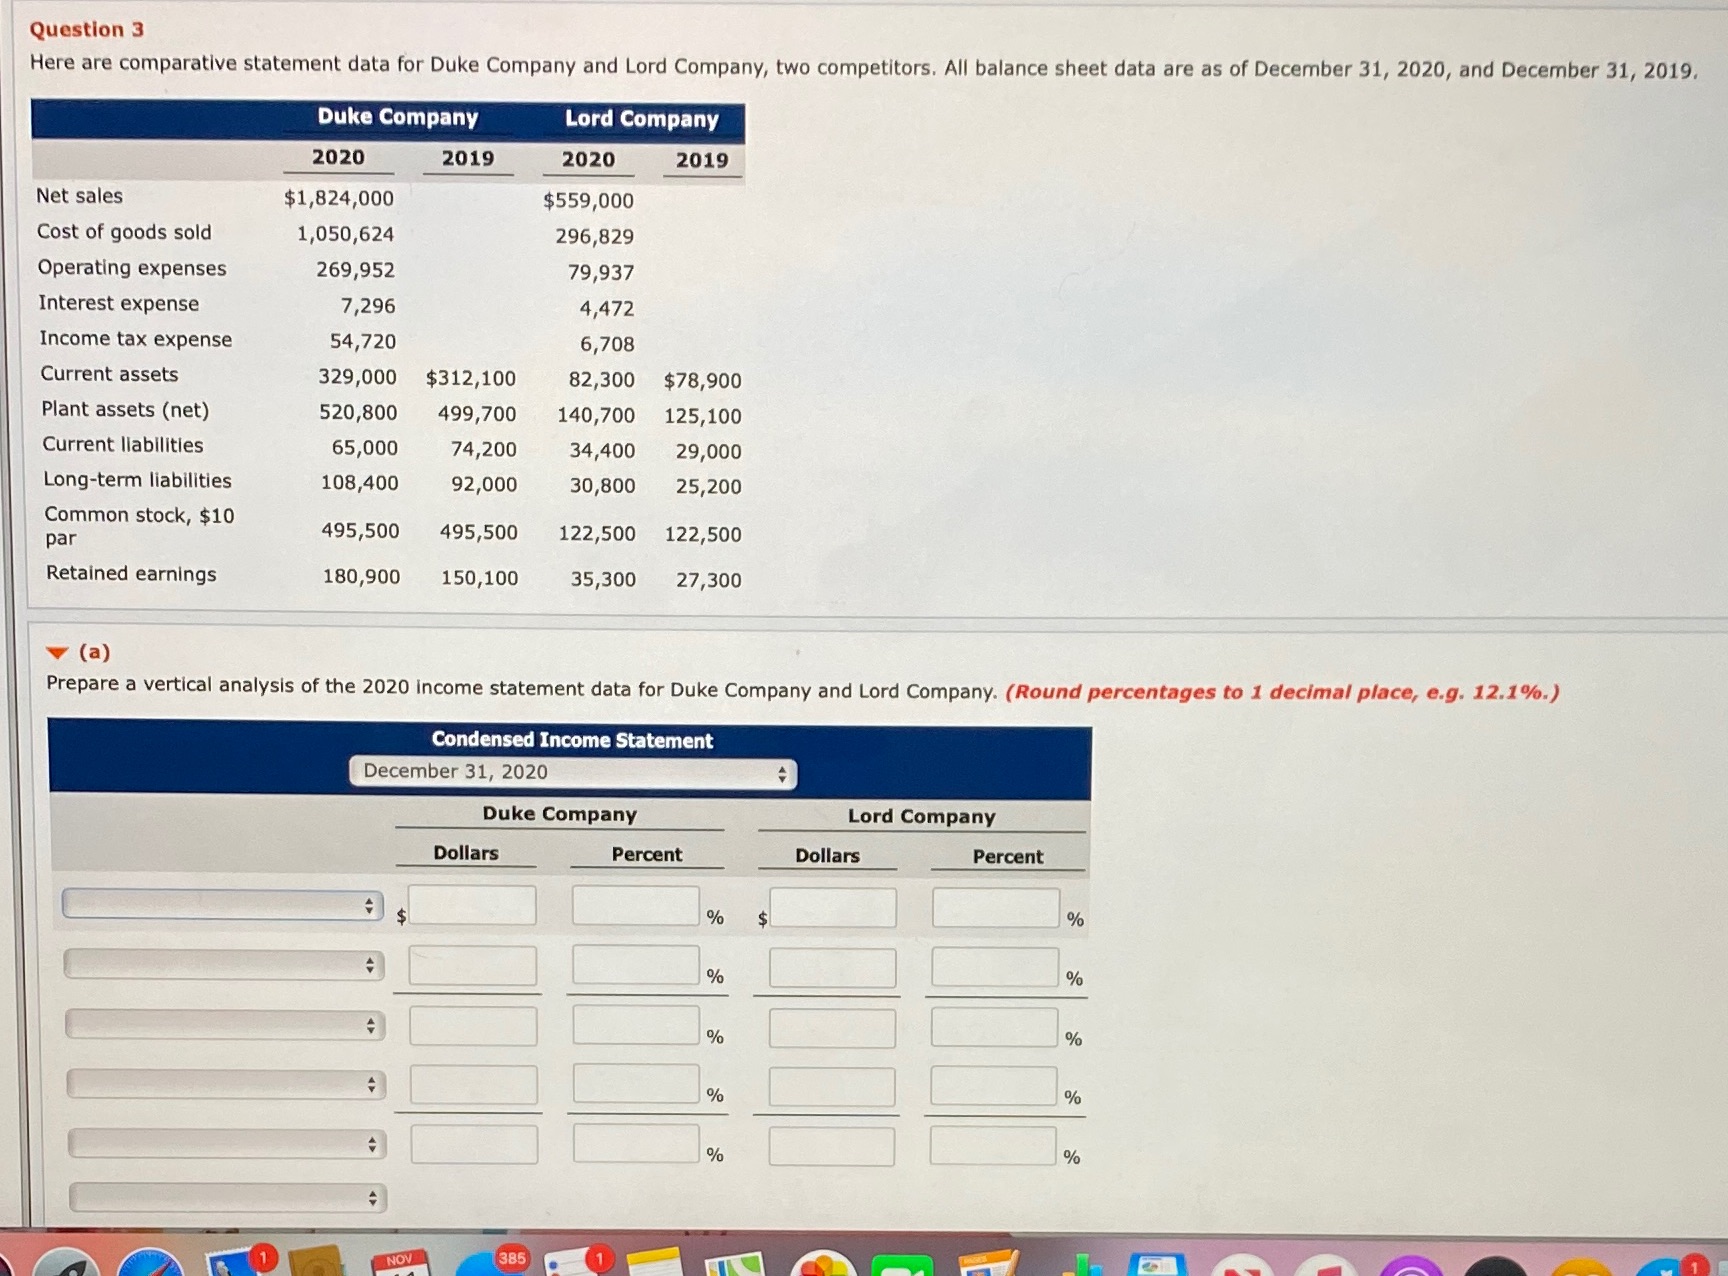

Question 3 Here are comparative statement data for Duke Company and Lord Company, two competitors. All balance sheet data are as of December 31, 2020, and December 31, 2019. Duke Company Lord Company 2020 2019 2020 2019 Net sales $1,824,000 $559,000 Cost of goods sold 1,050,624 296,829 Operating expenses 269,952 79,937 Interest expense 7,296 4,472 Income tax expense 54,720 6,708 Current assets 329,000 $312,100 82,300 $78,900 Plant assets (net) 520,800 499,700 140,700 125,100 Current liabilities 65,000 74,200 34,400 29,000 Long-term liabilities 108,400 92,000 30,800 25,200 Common stock, $10 par 495,500 495,500 122,500 122,500 Retained earnings 180,900 150,100 35,300 27,300 (a) Prepare a vertical analysis of the 2020 income statement data for Duke Company and Lord Company. (Round percentages to 1 decimal place, e.g. 12.1%.) Condensed Income Statement December 31, 2020 Duke Company Lord Company Dollars Percent Dollars Percent % % NOV 385 1
Step by Step Solution
There are 3 Steps involved in it

Get step-by-step solutions from verified subject matter experts