

Question: Question 3: Interpret the 95% confidence interval found on the output in the context of the problem. 1 i B I PA Based on the

Question 3:
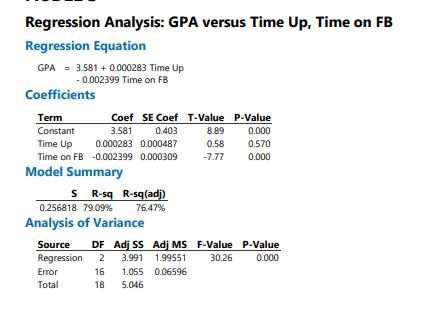

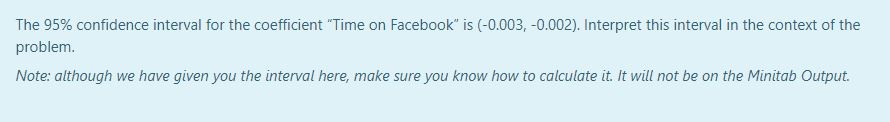
Interpret the 95% confidence interval found on the output in the context of the problem. 1 i B I PA Based on the three regression models provided on the Minitab output (labelled as Model 1, Model 2 and Model 3), which of the models shown would you recommend using, and why? 1 i B I ERegression Analysis: GPA versus Time Up, Time on FB Regression Equation GPA = 3.581 + 0.000283 Time Up - 0.002399 Time on FB Coefficients Term Coef SE Coef T-Value P-Value Constant 3.581 0.403 8.89 D.000 Time Up 0.000283 0.000487 0.58 0.570 Time on FB -0.002399 0.000309 -7.77 0.000 Model Summary S R-sq R-sq(adj) 0.256818 79.09% 76.47% Analysis of Variance Source DF Adj $5 Adj MS F-Value P-Value Regression 2 3.991 1.99551 30.26 0.000 Error 16 1.055 0.06596 Total 18 5.046The 95% confidence interval for the coefficient "Time on Facebook" is (-0.003, -0.002). Interpret this interval in the context of the problem. Note: although we have given you the interval here, make sure you know how to calculate it. It will not be on the Minitab Output
Step by Step Solution
There are 3 Steps involved in it

Get step-by-step solutions from verified subject matter experts