Question: Question 3: Optimization (30 points) - Do not build optimization model - Qssur, a small prosthesis manufacturer has been contracted by the Red Cross to
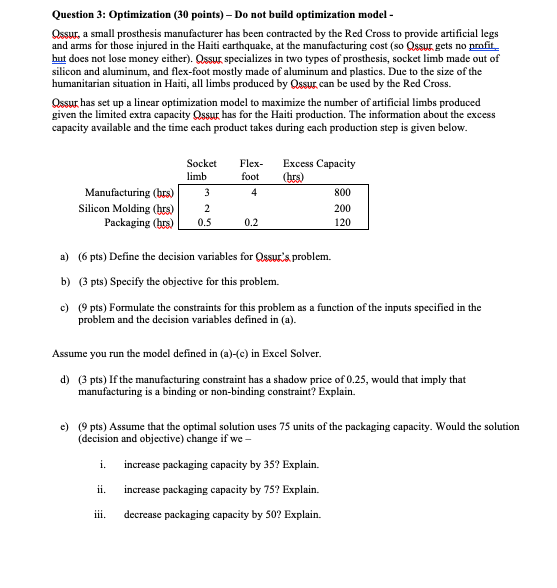
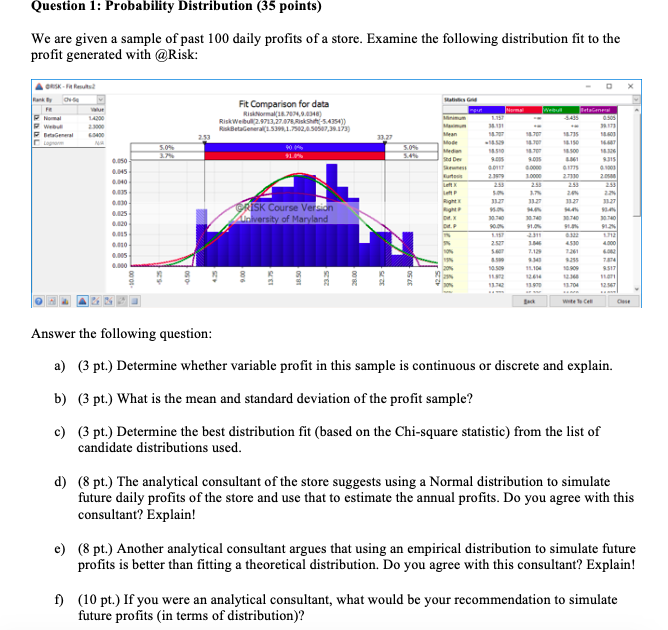
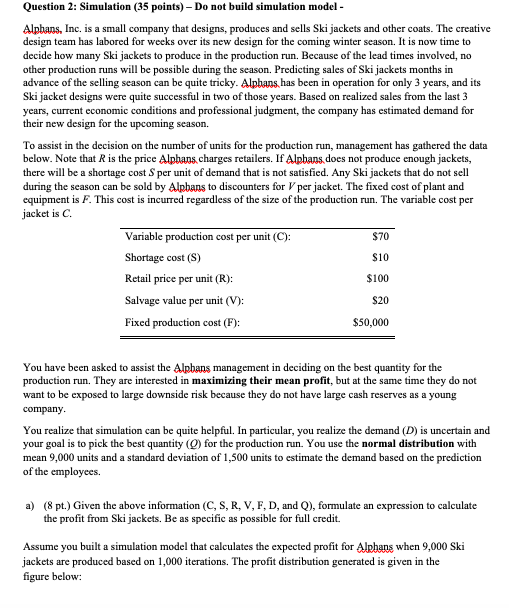
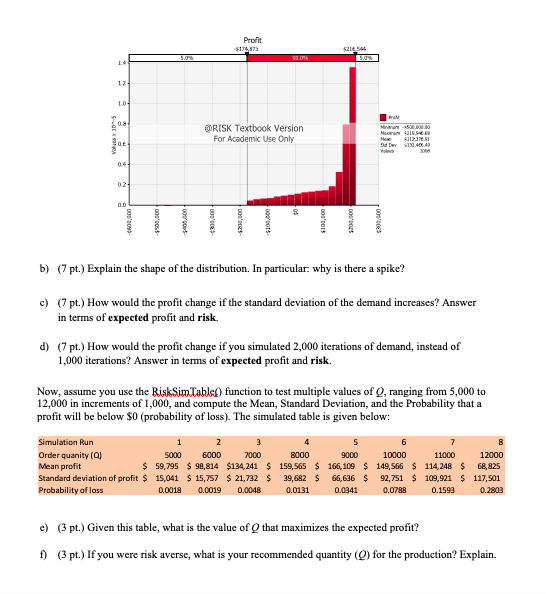
Question 3: Optimization (30 points) - Do not build optimization model - Qssur, a small prosthesis manufacturer has been contracted by the Red Cross to provide artificial legs and arms for those injured in the Haiti earthquake, at the manufacturing cost (so Qssur gets no profit but does not lose money either). Qssur specializes in two types of prosthesis, socket limb made out of silicon and aluminum, and flex-foot mostly made of aluminum and plastics. Due to the size of the humanitarian situation in Haiti, all limbs produced by Qssur can be used by the Red Cross. Assur has set up a linear optimization model to maximize the number of artificial limbs produced given the limited extra capacity Qssur has for the Haiti production. The information about the excess capacity available and the time each product takes during each production step is given below. Socket Flex- Excess Capacity limb foot Chrs Manufacturing (brs) 3 4 800 Silicon Molding (hrs) 200 Packaging (brs) IN 0.5 0.2 120 a) (6 pts) Define the decision variables for Qssur's problem. b) (3 pts) Specify the objective for this problem. c) (9 pts) Formulate the constraints for this problem as a function of the inputs specified in the problem and the decision variables defined in (a). Assume you run the model defined in (a)-(c) in Excel Solver. d) (3 pts) If the manufacturing constraint has a shadow price of 0.25, would that imply that manufacturing is a binding or non-binding constraint? Explain. e) (9 pts) Assume that the optimal solution uses 75 units of the packaging capacity. Would the solution (decision and objective) change if we - 1. increase packaging capacity by 35? Explain. ii. increase packaging capacity by 75? Explain. iii. decrease packaging capacity by 50? Explain.Question 1: Probability Distribution (35 points) We are given a sample of past 100 daily profits of a store. Examine the following distribution fit to the profit generated with @Risk: X Fit Comparison for data 11.37 2 1979 10900 2 59 RISK Course Version Right University of Maryland 4809 TATA B-SIT 41.970 Answer the following question: a) (3 pt.) Determine whether variable profit in this sample is continuous or discrete and explain. b) (3 pt.) What is the mean and standard deviation of the profit sample? c) (3 pt.) Determine the best distribution fit (based on the Chi-square statistic) from the list of candidate distributions used. d) (8 pt.) The analytical consultant of the store suggests using a Normal distribution to simulate future daily profits of the store and use that to estimate the annual profits. Do you agree with this consultant? Explain! e) (8 pt.) Another analytical consultant argues that using an empirical distribution to simulate future profits is better than fitting a theoretical distribution. Do you agree with this consultant? Explain! (10 pt.) If you were an analytical consultant, what would be your recommendation to simulate future profits (in terms of distribution)?Question 2: Simulation (35 points) - Do not build simulation model - Alphans, Inc. is a small company that designs, produces and sells Ski jackets and other coats. The creative design team has labored for weeks over its new design for the coming winter season. It is now time to decide how many Ski jackets to produce in the production run. Because of the lead times involved, no other production runs will be possible during the season. Predicting sales of Ski jackets months in advance of the selling season can be quite tricky. Alphans has been in operation for only 3 years, and its Ski jacket designs were quite successful in two of those years. Based on realized sales from the last 3 years, current economic conditions and professional judgment, the company has estimated demand for their new design for the upcoming season. To assist in the decision on the number of units for the production run, management has gathered the data below. Note that R is the price Alphans charges retailers. If Alpbans does not produce enough jackets, there will be a shortage cost $ per unit of demand that is not satisfied. Any Ski jackets that do not sell during the season can be sold by Alpbans to discounters for I' per jacket. The fixed cost of plant and equipment is F. This cost is incurred regardless of the size of the production run. The variable cost per jacket is C. Variable production cost per unit (C): $70 Shortage cost (S) $10 Retail price per unit (R): $100 Salvage value per unit (V): $20 Fixed production cost (F): $50,000 You have been asked to assist the Alphans management in deciding on the best quantity for the production run. They are interested in maximizing their mean profit, but at the same time they do not want to be exposed to large downside risk because they do not have large cash reserves as a young company. You realize that simulation can be quite helpful. In particular, you realize the demand (D) is uncertain and your goal is to pick the best quantity (Q) for the production run. You use the normal distribution with mean 9,000 units and a standard deviation of 1,500 units to estimate the demand based on the prediction of the employees. a) (8 pt.) Given the above information (C, S, R. V, F. D, and Q), formulate an expression to calculate the profit from Ski jackets. Be as specific as possible for full credit. Assume you built a simulation model that calculates the expected profit for Alphans when 9,000 Ski jackets are produced based on 1,000 iterations. The profit distribution generated is given in the figure below:Profi $174 975 LA LO @RISK Textbook Version For Academic Use Only -$504,600 -$405,400 $203,600 $101,600 $103,600 $304.400 b) (7 pt.) Explain the shape of the distribution. In particular. why is there a spike? c) (7 pt.) How would the profit change if the standard deviation of the demand increases? Answer in terms of expected profit and risk. d) (7 pt.) How would the profit change if you simulated 2,000 iterations of demand, instead of 1,000 iterations? Answer in terms of expected profit and risk. Now, assume you use the RiskSimTable) function to test multiple values of O, ranging from 5,000 to 12,000 in increments of 1,000, and compute the Mean, Standard Deviation, and the Probability that a profit will be below $0 (probability of loss). The simulated table is given below: Simulation Run Order quanity (0) 5000 7000 8000 9000 10000 11000 12000 Mean profit $ 59,795 $ 98,814 $134,241 $ 159,565 $ 166,109 $ 149,566 $ 114,248 $ 68, 825 Standard deviation of profit $ 15,041 $ 15,757 $ 21,732 $ 39,682 $ 66,636 $ 92,751 $ 109,921 $ 117,501 Probability of loss 0.0018 0.0019 0.0048 0.0131 0.0341 0.0788 0.1593 0.3803 c) (3 pt.) Given this table, what is the value of ( that maximizes the expected profit? () (3 pt.) If you were risk averse, what is your recommended quantity (O) for the production? Explain