

Question: question 3 please and i have provided the data Bookmarks Window Help AutoSave @ OFF A 6 . 06 - 3 ITIS_1P97 assignment1 - Saved
question 3 please and i have provided the data
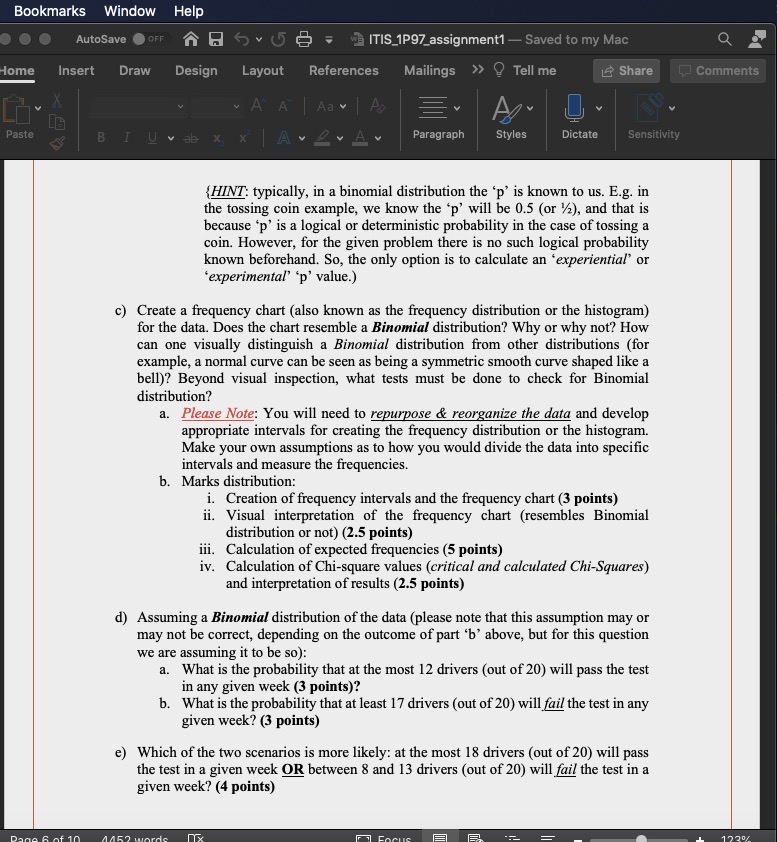
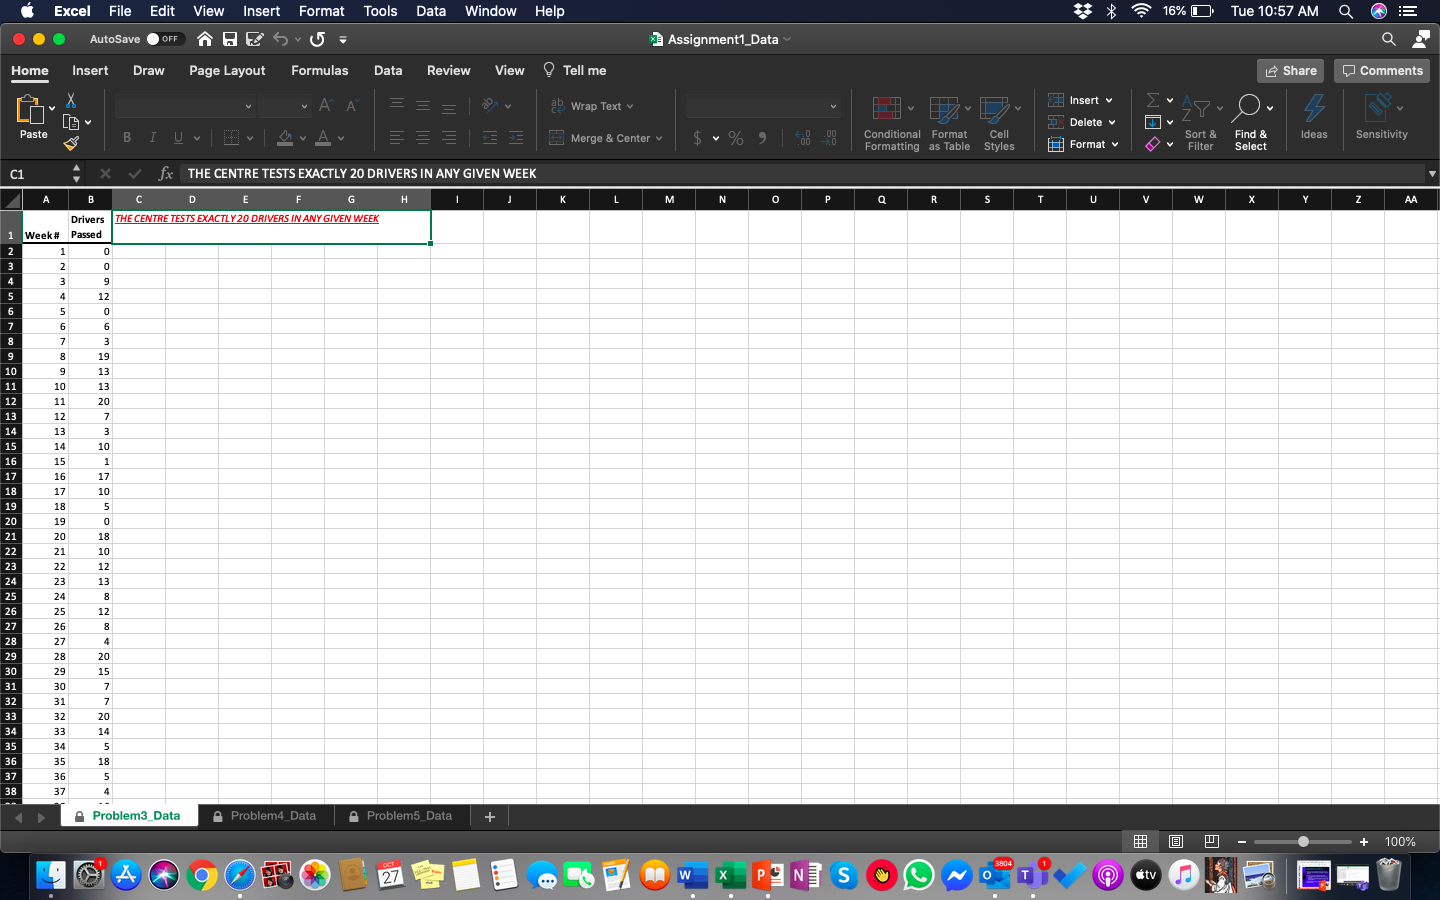
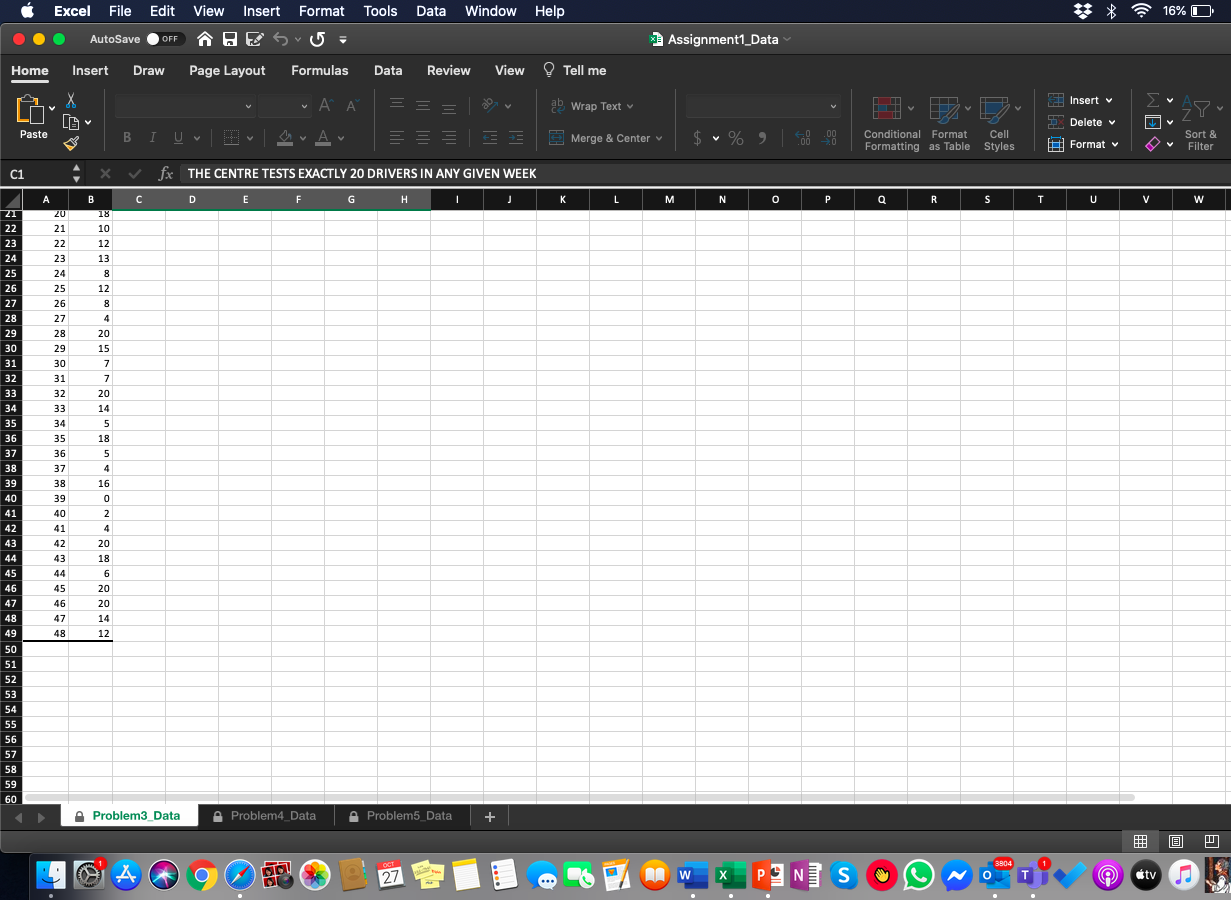
Bookmarks Window Help AutoSave @ OFF A 6 . 06 - 3 ITIS_1P97 assignment1 - Saved to my Mac Home Insert Draw Design Layout References Mailings >> Tell me Share Comments AA Aa A v Paste B I Uva A Paragraph Styles Dictate Sensitivity PROBLEM 3 (25 TOTAL POINTS): Refer to the data in the attached spreadsheet (Assignment]_Data.xisx), under the tab "Problme3 Data", then answer the following questions: a) We will test if the given data fits a Binomial distribution. The data represents the number of Drivers who pass a driving test at an approved road-testing location. We assume that the location tests only & exactly 20 drivers per week. The number of drivers (out of 20) that passed the test in a given week, over 48 consecutive weeks, are listed in column 'B' of the sheet. b) To do the calculations you will need a value for the parameter 'p' used in the formula for Binomial Distribution: the probability of a specific outcome (passing the test in this case). What is the value of 'p' that you will use for the calculations in this case? What is the basis for your choice? (2 points). Page 5 of 10 @ Dipanjan Chatterjee, Brock University 2020 (HINT: typically, in a binomial distribution the 'p' is known to us. E.g. in the tossing coin example, we know the 'p' will be 0.5 (or 1/2), and that is because 'p' is a logical or deterministic probability in the case of tossing a coin. However, for the given problem there is no such logical probability known beforehand. So, the only option is to calculate an "experiential" or 'experimental" *p' value.) c) Create a frequency chart (also known as the frequency distribution or the histogram) for the data. Does the chart resemble a Binomial distribution? Why or why not? How can one visually distinguish a Binomial distribution from other distributions (for example, a normal curve can be seen as being a symmetric smooth curve shaped like a bell)? Beyond visual inspection, what tests must be done to check for Binomial distribution? Plan I develon Page 5 of 10 4452 words [ ] Focus + 123%Bookmarks Window Help AutoSave . OFF A 6. 65 - ITIS_1P97 assignment1 - Saved to my Mac Q Home Insert Draw Design Layout References Mailings >> 9 Tell me Share Comments A Aa Pasto B I A Paragraph Styles Dictate Sensitivity (HINT: typically, in a binomial distribution the 'p' is known to us. E.g. in the tossing coin example, we know the *p' will be 0.5 (or /2), and that is because 'p' is a logical or deterministic probability in the case of tossing a coin. However, for the given problem there is no such logical probability known beforehand. So, the only option is to calculate an *experiential" or experimental' 'p' value.) c) Create a frequency chart (also known as the frequency distribution or the histogram) for the data. Does the chart resemble a Binomial distribution? Why or why not? How can one visually distinguish a Binomial distribution from other distributions (for example, a normal curve can be seen as being a symmetric smooth curve shaped like a bell)? Beyond visual inspection, what tests must be done to check for Binomial distribution? a. Please Note: You will need to repurpose & reorganize the data and develop appropriate intervals for creating the frequency distribution or the histogram. Make your own assumptions as to how you would divide the data into specific intervals and measure the frequencies. b. Marks distribution: i. Creation of frequency intervals and the frequency chart (3 points) ii. Visual interpretation of the frequency chart (resembles Binomial distribution or not) (2.5 points) iii. Calculation of expected frequencies (5 points) iv. Calculation of Chi-square values (critical and calculated Chi-Squares) and interpretation of results (2.5 points) d) Assuming a Binomial distribution of the data (please note that this assumption may or may not be correct, depending on the outcome of part 'b' above, but for this question we are assuming it to be so): a. What is the probability that at the most 12 drivers (out of 20) will pass the test in any given week (3 points)? b. What is the probability that at least 17 drivers (out of 20) will fail the test in any given week? (3 points) e) Which of the two scenarios is more likely: at the most 18 drivers (out of 20) will pass the test in a given week OR between 8 and 13 drivers (out of 20) will fail the test in a given week? (4 points)Excel File Edit View Insert Format Tools Data Window Help 16% Tue 10:57 AM Q AutoSave . OFF 1 Assignment1_Data Home Insert Draw Page Layout Formulas Data Review View Tell me Share Comments X AA 2g Wrap Text v Insert v BI UV FY Delete v Paste Merge & Center v % 19 Conditional Format Cell Format v Sort & Find & deas Sensitivity Formatting as Table Styles Filter Select C1 X V fx THE CENTRE TESTS EXACTLY 20 DRIVERS IN ANY GIVEN WEEK A B C D K L M N P Q R S T U v W X Y Z AA Drivers THE CENTRE TESTS EXACTLY 20 DRIVERS IN ANY GIVEN WEEK 1 Week # Passed W N Problem3_Data Problem4_Data A Problem5_Data + - + 100% L 4 OCT 27i Excel File Edit View insert Format Tools Data Window Help 0 Am . {a} E (5 . i=3 Assignment'LDala Home Insert Draw Page. Layout Formulas Data Review View _ Tell me Lilv D11" THE CENTRE TESTS EXACTLY 20 DRIVERS IN ANY GIVEN WEEK
Step by Step Solution
There are 3 Steps involved in it

Get step-by-step solutions from verified subject matter experts