

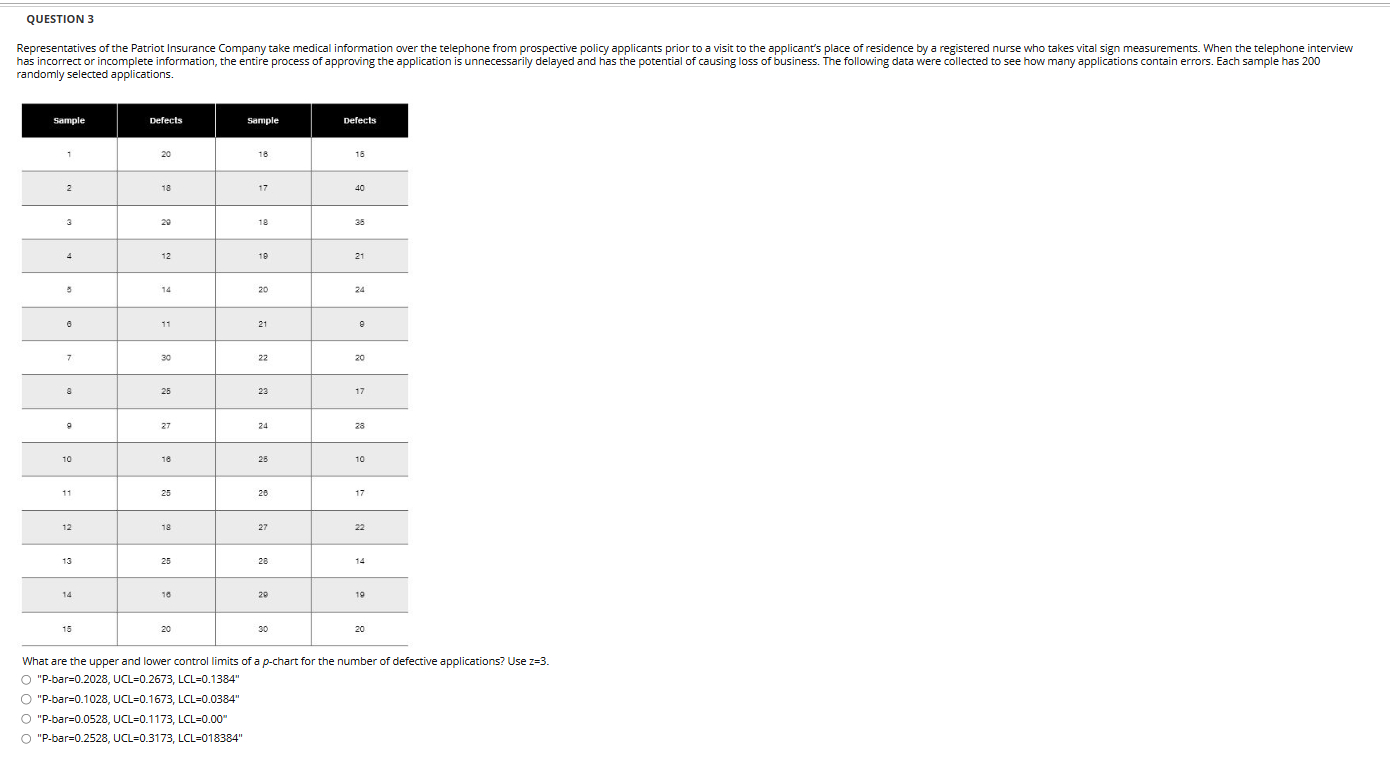
Question: QUESTION 3 randomly selected applications. What are the upper and lower control limits of a p - chart for the number of defective applications? Use
QUESTION
randomly selected applications.
What are the upper and lower control limits of a chart for the number of defective applications? Use
Pbar UCL LCL
Pbar UCL LCL
Pbar UCL LCL
Pbar UCL LCL
Are there any samples out of control?
Step by Step Solution
There are 3 Steps involved in it
1 Expert Approved Answer
Step: 1 Unlock

Question Has Been Solved by an Expert!
Get step-by-step solutions from verified subject matter experts
Step: 2 Unlock
Step: 3 Unlock