

Question: Question 3 Select the correct answers and illustrate your solution in the diagram The figure shows equilibrium in the goods market, with the curve
Question
Select the correct answers and illustrate your solution in the diagram
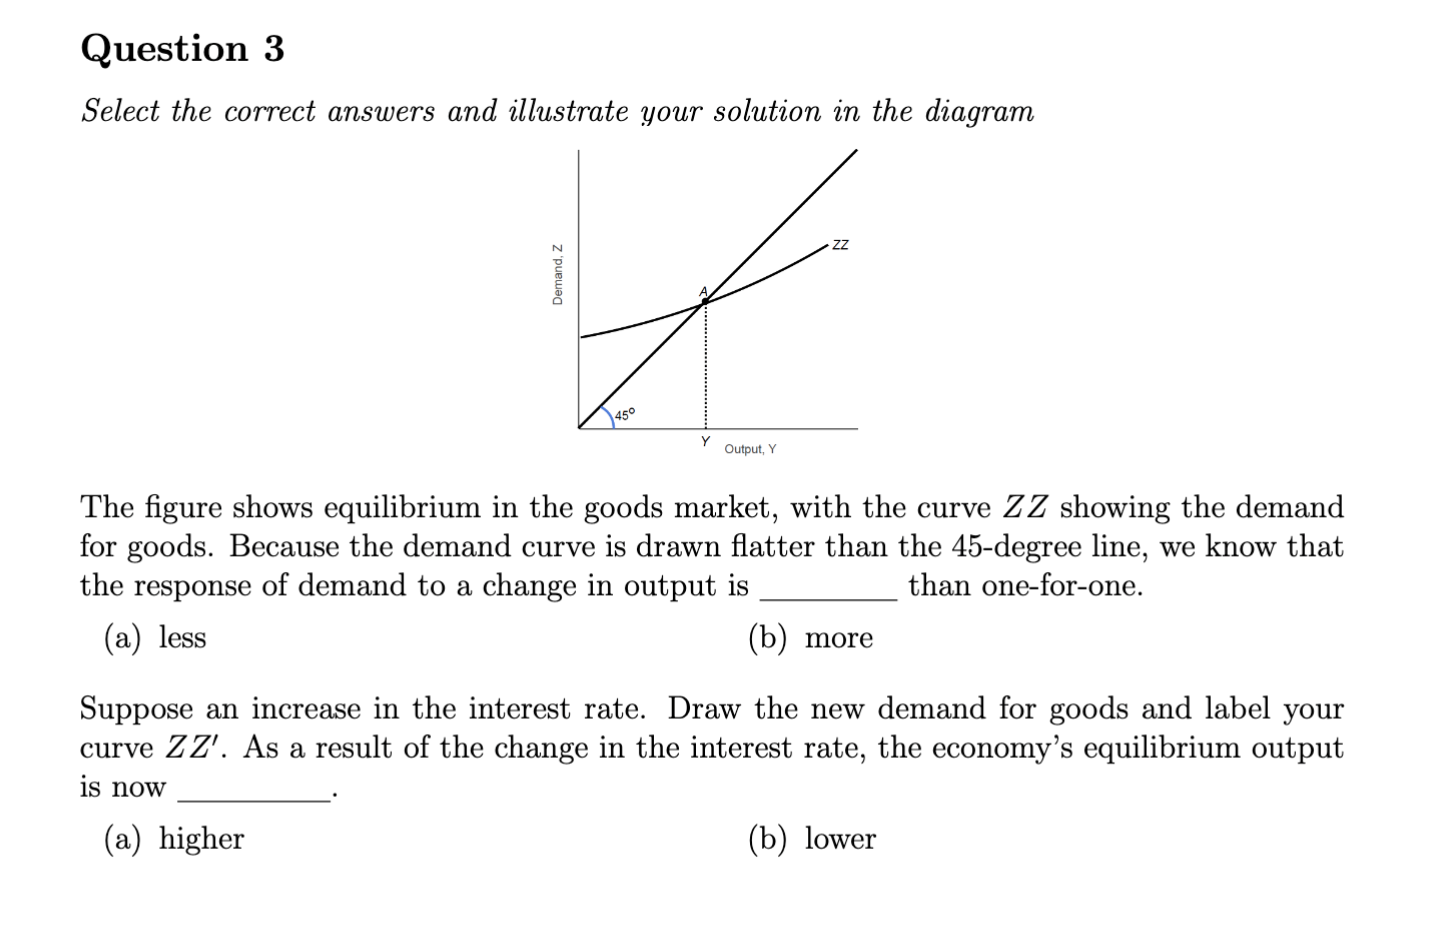
The figure shows equilibrium in the goods market, with the curve Z Z showing the demand for goods. Because the demand curve is drawn flatter than the degree line, we know that the response of demand to a change in output is than oneforone.
a less
b more
Suppose an increase in the interest rate. Draw the new demand for goods and label your curve Z Zprime As a result of the change in the interest rate, the economy's equilibrium output is now
a higher
b lower
Step by Step Solution
There are 3 Steps involved in it
1 Expert Approved Answer
Step: 1 Unlock

Question Has Been Solved by an Expert!
Get step-by-step solutions from verified subject matter experts
Step: 2 Unlock
Step: 3 Unlock