

Question: Select the correct answers and illustrate your solution in the diagram Demand. Z Y Omput, v The gure shows equilibrium in the goods market, with

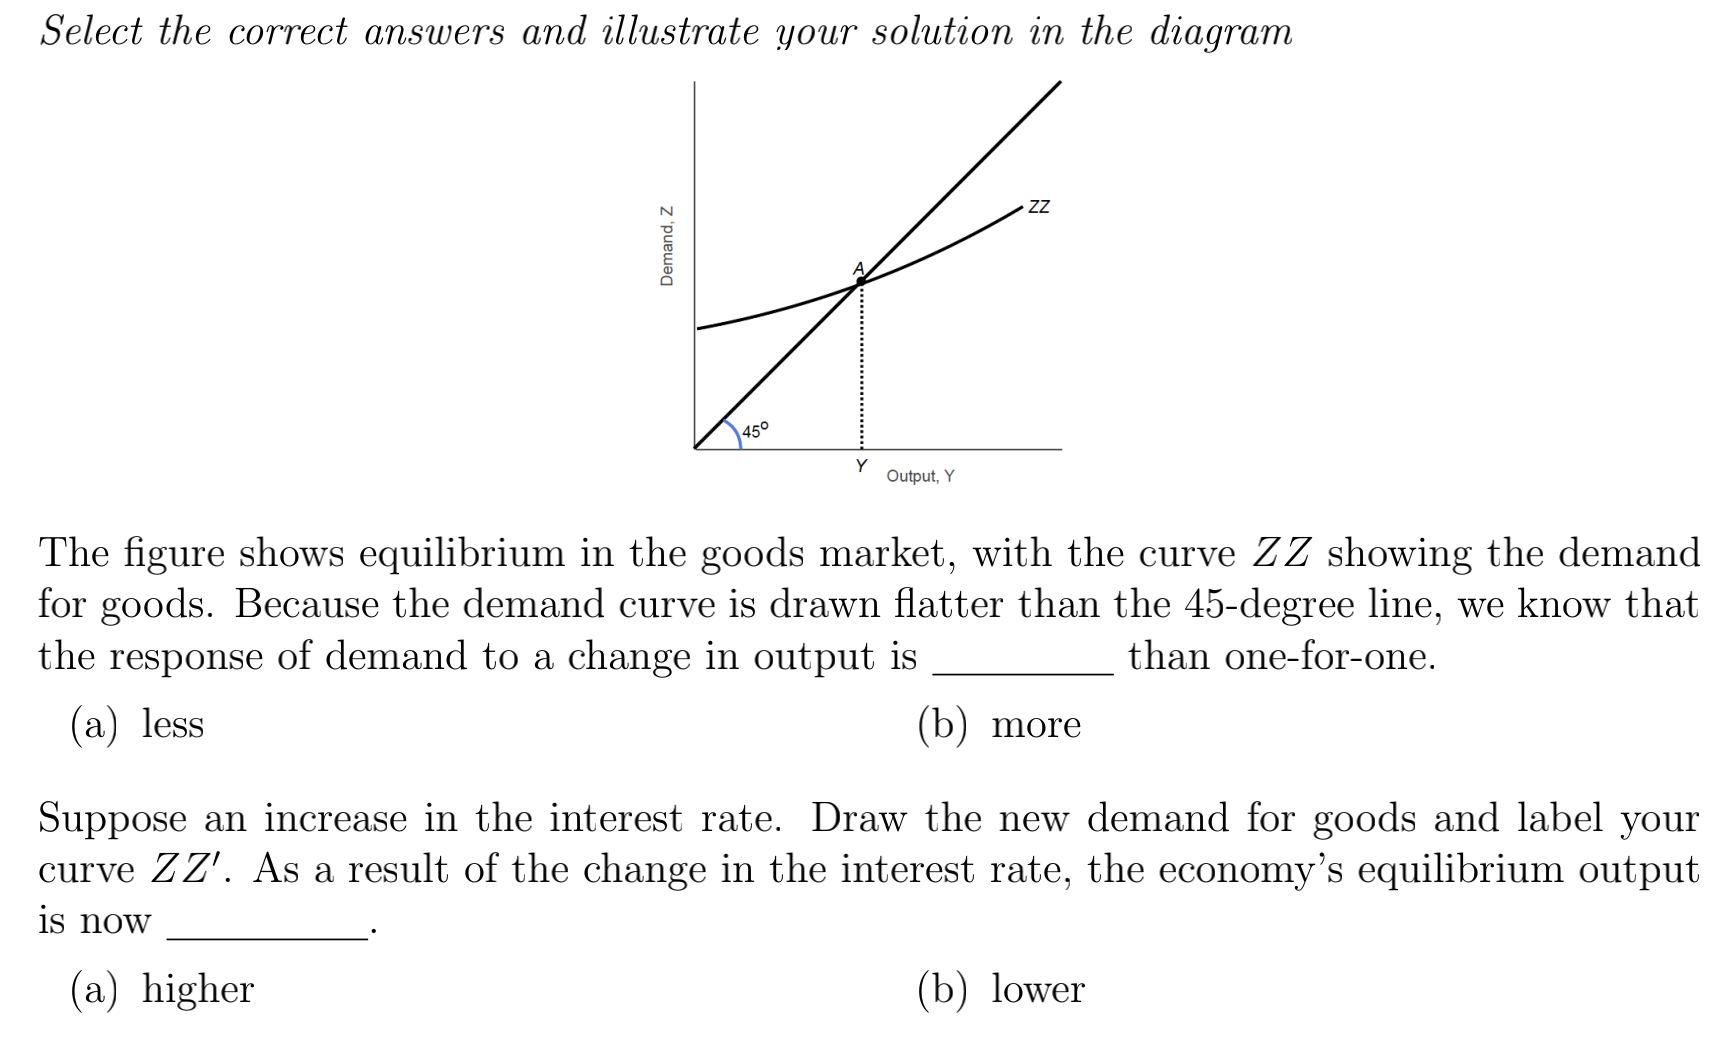
Select the correct answers and illustrate your solution in the diagram Demand. Z Y Omput, v The gure shows equilibrium in the goods market, with the curve Z Z showing the demand for goods. Because the demand curve is drawn atter than the 45degree line, we know that the response of demand to a change in output is than oneforone. (a) less (b) more Suppose an increase in the interest rate. Draw the new demand for goods and label your curve Z Z' . As a result of the change in the interest rate, the economy's equilibrium output is now (a) higher (b) lower
Step by Step Solution
There are 3 Steps involved in it
1 Expert Approved Answer
Step: 1 Unlock

Question Has Been Solved by an Expert!
Get step-by-step solutions from verified subject matter experts
Step: 2 Unlock
Step: 3 Unlock