

Question: QUESTION 3 Table 1 below shows the relationship between prices, quantity demanded and quantity supplies. Table 1 begin { tabular } { | c
QUESTION
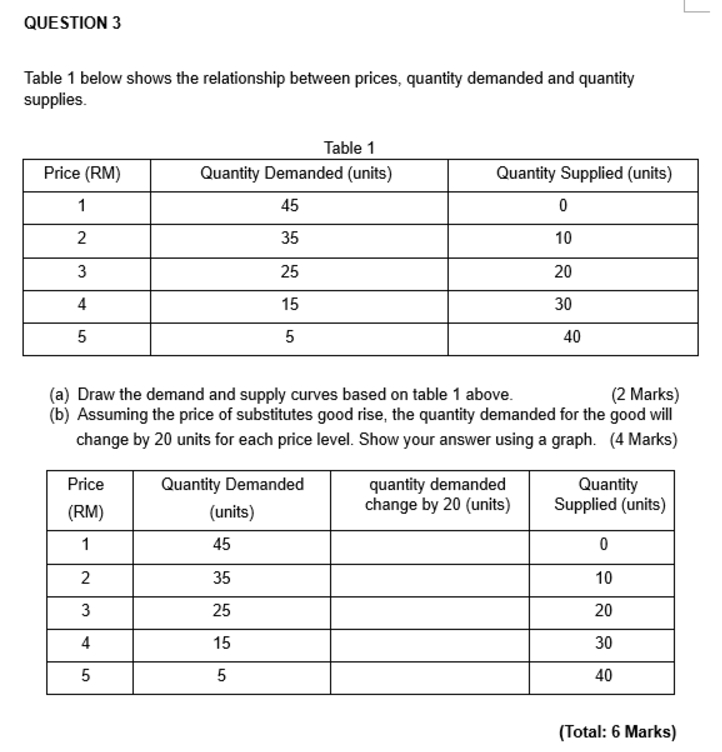
Table below shows the relationship between prices, quantity demanded and quantity supplies.
Table
begintabularccc
hline Price RM & Quantity Demanded units & Quantity Supplied units
hline & &
hline & &
hline & &
hline & &
hline & &
hline
endtabular
a Draw the demand and supply curves based on table above.
Marks
b Assuming the price of substitutes good rise, the quantity demanded for the good will change by units for each price level. Show your answer using a graph. Marks
begintabularcccc
hline begintabularc
Price
RM
endtabular & begintabularc
Quantity Demanded
units
endtabular & begintabularc
quantity demanded
change by units
endtabular & begintabularc
Quantity
Supplied units
endtabular
hline & & &
hline & & &
hline & & &
hline & & &
hline & &
hline
endtabular
Total: Marks
Step by Step Solution
There are 3 Steps involved in it
1 Expert Approved Answer
Step: 1 Unlock

Question Has Been Solved by an Expert!
Get step-by-step solutions from verified subject matter experts
Step: 2 Unlock
Step: 3 Unlock