

Question: Question 3 The open - loop frequency response of the equipment used in a temperature control system was measured to produce the results given in
Question
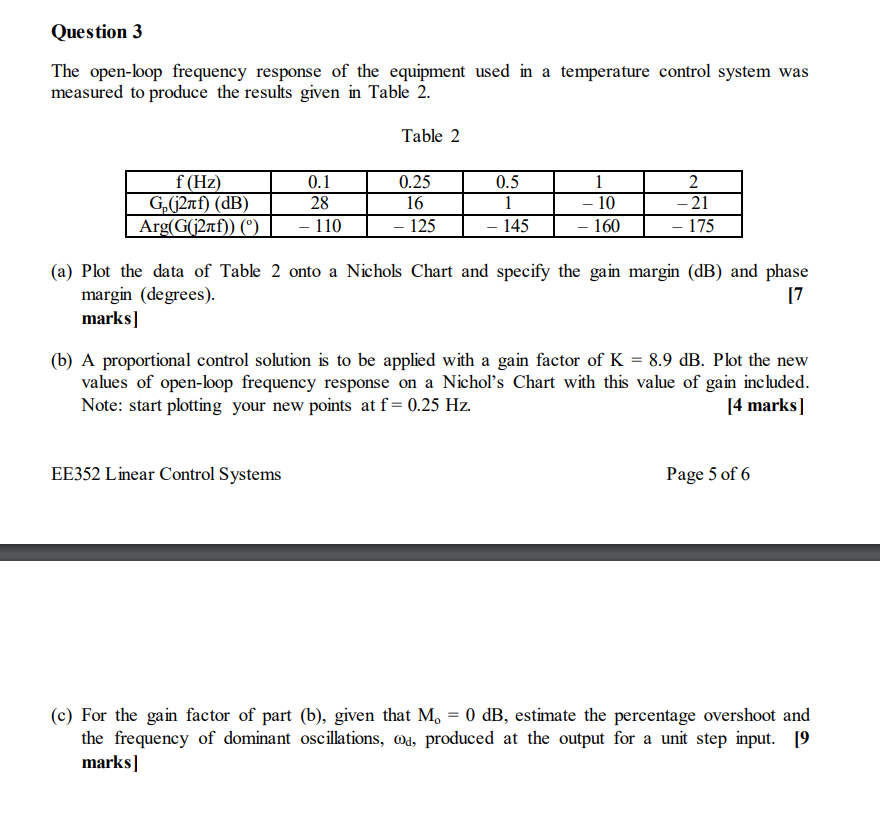
The openloop frequency response of the equipment used in a temperature control system was measured to produce the results given in Table
Table
a Plot the data of Table onto a Nichols Chart and specify the gain margin dB and phase margin degrees
marks
b A proportional control solution is to be applied with a gain factor of mathrmKmathrm~dB Plot the new values of openloop frequency response on a Nichol's Chart with this value of gain included. Note: start plotting your new points at mathrmfmathrm~Hz
c For the gain factor of part b given that mathrmMmathrmomathrm~dB estimate the percentage overshoot and the frequency of dominant oscillations, omegamathrmd produced at the output for a unit step input.
marks
Step by Step Solution
There are 3 Steps involved in it
1 Expert Approved Answer
Step: 1 Unlock

Question Has Been Solved by an Expert!
Get step-by-step solutions from verified subject matter experts
Step: 2 Unlock
Step: 3 Unlock