

Question: Question 3 Measured open - loop frequency response data for a unity feedback system using PID control is given in Table 2 . Table 2
Question
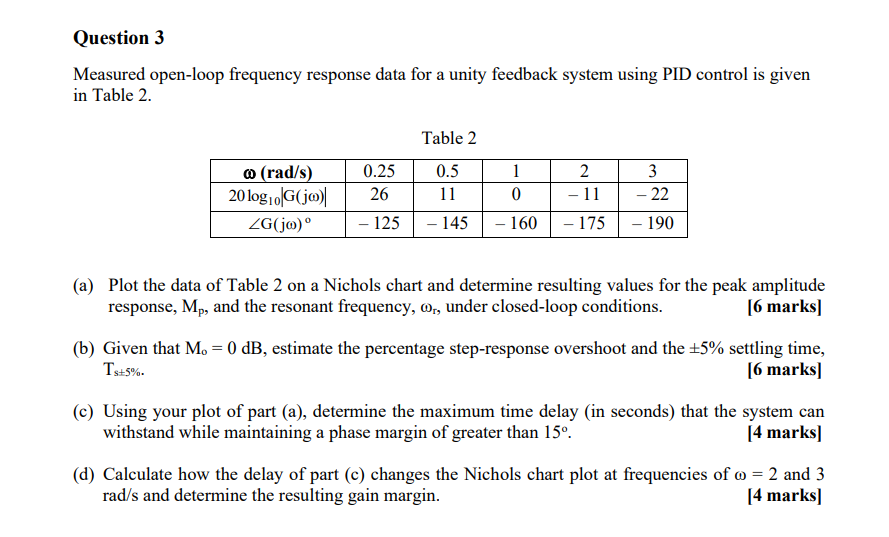
Measured openloop frequency response data for a unity feedback system using PID control is given in Table
Table
a Plot the data of Table on a Nichols chart and determine resulting values for the peak amplitude response, mathrmMmathrmp and the resonant frequency, omegamathrmr under closedloop conditions.
marks
b Given that mathrmMmathrmomathrm~dB estimate the percentage stepresponse overshoot and the pm settling time, mathrmTmathrmspm
marks
c Using your plot of part a determine the maximum time delay in seconds that the system can withstand while maintaining a phase margin of greater than circ
marks
d Calculate how the delay of part c changes the Nichols chart plot at frequencies of omega and mathrmradmathrms and determine the resulting gain margin.
marks
Step by Step Solution
There are 3 Steps involved in it
1 Expert Approved Answer
Step: 1 Unlock

Question Has Been Solved by an Expert!
Get step-by-step solutions from verified subject matter experts
Step: 2 Unlock
Step: 3 Unlock