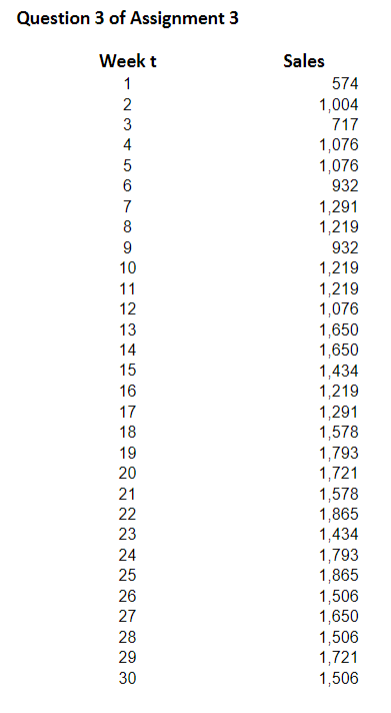
Question: Question 3. The spreadsheet Question3-Forecasting.xlsx has data for the past 30 weeks of sales for product X. Based on the data, do the following questions.

Question 3. The spreadsheetQuestion 3. The spreadsheet

Question 3. The spreadsheet "Question3-Forecasting.xlsx" has data for the past 30 weeks of sales for product X. Based on the data, do the following questions. [If you use Excel to solve this question, submit the excel file along with your solutions to the assignment. Note that you need to explain your answers to the following questions in detail, and just submitting the calculations done by excel is not enough.] (a) Plot the data. Just by looking at the plot, do you think a 3-week simple moving average would be a better forecast, or a 6-week simple moving average? Just by looking at the plot, do you think an exponential smoothing with value of a = 0.2 would be better forecast or would a = 0.6 be better? Explain your reasoning. (b) Which one of the four possible forecasts mentioned in part (a) (3-week and 6-week simple moving average and exponential smoothing with value of a = 0.2 and a = 0.6) is the best forecast? Justify your answer by calculating MAD. (Different people could reach different conclusions, but you need to give good reasons for your conclusions.) Question 3 of Assignment 3 OU AWN Weekt 1 2 3 4 5 6 7 8 9 10 11 12 13 14 15 16 17 18 19 Sales 574 1,004 717 1,076 1,076 932 1,291 1,219 932 1,219 1,219 1,076 1,650 1,650 1,434 1,219 1,291 1,578 1,793 1,721 1,578 1,865 1,434 1,793 1,865 1,506 1,650 1,506 1,721 1,506 20 21 22 23 24 25 26 27 28 29 30

Step by Step Solution

There are 3 Steps involved in it

1 Expert Approved Answer
Step: 1 Unlock blur-text-image
Question Has Been Solved by an Expert!

Get step-by-step solutions from verified subject matter experts

Step: 2 Unlock
Step: 3 Unlock

Students Have Also Explored These Related General Management Questions!