

Question: Question 3 The table below provides the end-of-year share prices (in GB pence) for Centrica plc and National Express Group plc the end-of-year values for
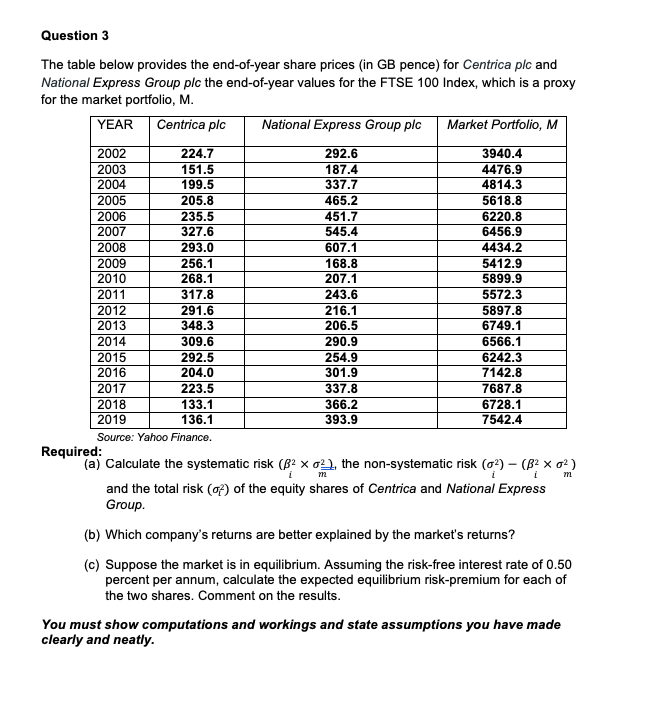
Question 3 The table below provides the end-of-year share prices (in GB pence) for Centrica plc and National Express Group plc the end-of-year values for the FTSE 100 Index, which is a proxy for the market portfolio, M. YEAR Centrica plc National Express Group plc Market Portfolio, M 2002 224.7 292.6 3940.4 2003 151.5 187.4 4476.9 2004 199.5 337.7 4814.3 2005 205.8 465.2 5618.8 2006 235.5 451.7 6220.8 2007 545.4 6456.9 2008 293.0 607.1 4434.2 2009 256.1 168.8 5412.9 2010 268.1 207.1 5899.9 2011 317.8 243.6 5572.3 2012 291.6 216.1 5897.8 2013 348.3 206.5 6749.1 2014 309.6 290.9 6566.1 2015 292.5 254.9 6242.3 2016 204.0 301.9 7142.8 2017 223.5 337.8 7687.8 2018 133.1 366.2 6728.1 2019 136.1 393.9 7542.4 Source: Yahoo Finance. Required: (a) Calculate the systematic risk (B202, the non-systematic risk (02) - (B2 x 02) i m i and the total risk () of the equity shares of Centrica and National Express Group m (6) Which company's returns are better explained by the market's returns? (c) Suppose the market is in equilibrium. Assuming the risk-free interest rate of 0.50 percent per annum, calculate the expected equilibrium risk-premium for each of the two shares. Comment on the results. You must show computations and workings and state assumptions you have made clearly and neatly. Question 3 The table below provides the end-of-year share prices (in GB pence) for Centrica plc and National Express Group plc the end-of-year values for the FTSE 100 Index, which is a proxy for the market portfolio, M. YEAR Centrica plc National Express Group plc Market Portfolio, M 2002 224.7 292.6 3940.4 2003 151.5 187.4 4476.9 2004 199.5 337.7 4814.3 2005 205.8 465.2 5618.8 2006 235.5 451.7 6220.8 2007 545.4 6456.9 2008 293.0 607.1 4434.2 2009 256.1 168.8 5412.9 2010 268.1 207.1 5899.9 2011 317.8 243.6 5572.3 2012 291.6 216.1 5897.8 2013 348.3 206.5 6749.1 2014 309.6 290.9 6566.1 2015 292.5 254.9 6242.3 2016 204.0 301.9 7142.8 2017 223.5 337.8 7687.8 2018 133.1 366.2 6728.1 2019 136.1 393.9 7542.4 Source: Yahoo Finance. Required: (a) Calculate the systematic risk (B202, the non-systematic risk (02) - (B2 x 02) i m i and the total risk () of the equity shares of Centrica and National Express Group m (6) Which company's returns are better explained by the market's returns? (c) Suppose the market is in equilibrium. Assuming the risk-free interest rate of 0.50 percent per annum, calculate the expected equilibrium risk-premium for each of the two shares. Comment on the results. You must show computations and workings and state assumptions you have made clearly and neatly
Step by Step Solution
There are 3 Steps involved in it

Get step-by-step solutions from verified subject matter experts