

Question: Question 3 The table below provides the end-of-year share prices (in pence) for GlaxoSmithKline plc and J Sainsbury plc, and the end-of-year values for the
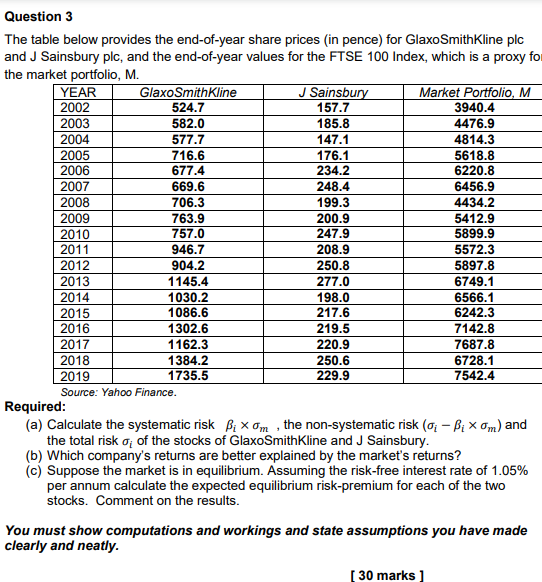
Question 3 The table below provides the end-of-year share prices (in pence) for GlaxoSmithKline plc and J Sainsbury plc, and the end-of-year values for the FTSE 100 Index, which is a proxy fo the market portfolio, M. YEAR GlaxoSmithKline J Sainsbury Market Portfolio, M 2002 524.7 157.7 3940.4 2003 582.0 185.8 4476.9 2004 577.7 147.1 4814.3 2005 716.6 176.1 5618.8 2006 677.4 234.2 6220.8 2007 669.6 248.4 6456.9 2008 706.3 199.3 4434.2 2009 763.9 200.9 5412.9 2010 757.0 247.9 5899.9 2011 946.7 208.9 5572.3 2012 904.2 250.8 5897.8 2013 1145.4 277.0 6749.1 2014 1030.2 198.0 6566.1 2015 1086.6 217.6 6242.3 2016 1302.6 219.5 7142.8 2017 1162.3 220.9 7687.8 2018 1384.2 250.6 6728.1 2019 1735.5 229.9 7542.4 Source: Yahoo Finance. Required: (a) Calculate the systematic risk Bixom, the non-systematic risk (o - Bixom) and the total risk o of the stocks of GlaxoSmithKline and J Sainsbury. (b) Which company's returns are better explained by the market's returns? (C) Suppose the market is in equilibrium. Assuming the risk-free interest rate of 1.05% per annum calculate the expected equilibrium risk-premium for each of the two stocks. Comment on the results. You must show computations and workings and state assumptions you have made clearly and neatly. (30 marks Question 3 The table below provides the end-of-year share prices (in pence) for GlaxoSmithKline plc and J Sainsbury plc, and the end-of-year values for the FTSE 100 Index, which is a proxy fo the market portfolio, M. YEAR GlaxoSmithKline J Sainsbury Market Portfolio, M 2002 524.7 157.7 3940.4 2003 582.0 185.8 4476.9 2004 577.7 147.1 4814.3 2005 716.6 176.1 5618.8 2006 677.4 234.2 6220.8 2007 669.6 248.4 6456.9 2008 706.3 199.3 4434.2 2009 763.9 200.9 5412.9 2010 757.0 247.9 5899.9 2011 946.7 208.9 5572.3 2012 904.2 250.8 5897.8 2013 1145.4 277.0 6749.1 2014 1030.2 198.0 6566.1 2015 1086.6 217.6 6242.3 2016 1302.6 219.5 7142.8 2017 1162.3 220.9 7687.8 2018 1384.2 250.6 6728.1 2019 1735.5 229.9 7542.4 Source: Yahoo Finance. Required: (a) Calculate the systematic risk Bixom, the non-systematic risk (o - Bixom) and the total risk o of the stocks of GlaxoSmithKline and J Sainsbury. (b) Which company's returns are better explained by the market's returns? (C) Suppose the market is in equilibrium. Assuming the risk-free interest rate of 1.05% per annum calculate the expected equilibrium risk-premium for each of the two stocks. Comment on the results. You must show computations and workings and state assumptions you have made clearly and neatly. (30 marks
Step by Step Solution
There are 3 Steps involved in it

Get step-by-step solutions from verified subject matter experts