

Question: Question 3 Using data from Wall Street Journal Market Diary, CBOE Daily Market Statistics and other financial data sources ( e . g . TR
Question
Using data from Wall Street Journal Market Diary, CBOE Daily Market Statistics and other financial data
sources eg TR Eikon, Bloomberg, Yahoo Finance, etc. calculate the following using the most recent
trading days your reference day can be the day you get the data to answer this question. Please indicate the
date clearly and include the data you use to answer this question.
a Trin ratio for the NYSE. Is the trin ratio bullish or bearish in each of the days?
b Relative strength of TESLA relative to industry index. Based on days of data, does TESLA
outperform or underperform the industry?
c Cumulative breadth for the NYSE for the most recent days. Can you infer any broad market
trend?
d PutCall ratio from CBOE Chicago Boards Option Exchange Do you infer investor pessimism
or optimism based on most recent days of data?
Question
Log on to
finance.yahoo.com or any other financial database of your choice to find the monthly dividend
adjusted closing prices for the most recent years for Abercrombie & Fitch ANF Also, collect the closing
level of the S&P Index over the same period.
Calculate the month moving average of both the stock and the S&P over time. For each series, use
Excel to plot the moving average against the actual level of the stock price or index. Examine the instances
where the moving average and price series cross.
Is the stock more or less likely to increase when the price crosses through the moving average?
Does it matter whether the price crosses the moving average from above or below?
How reliable would an investment rule based on moving averages be
Part II
Question
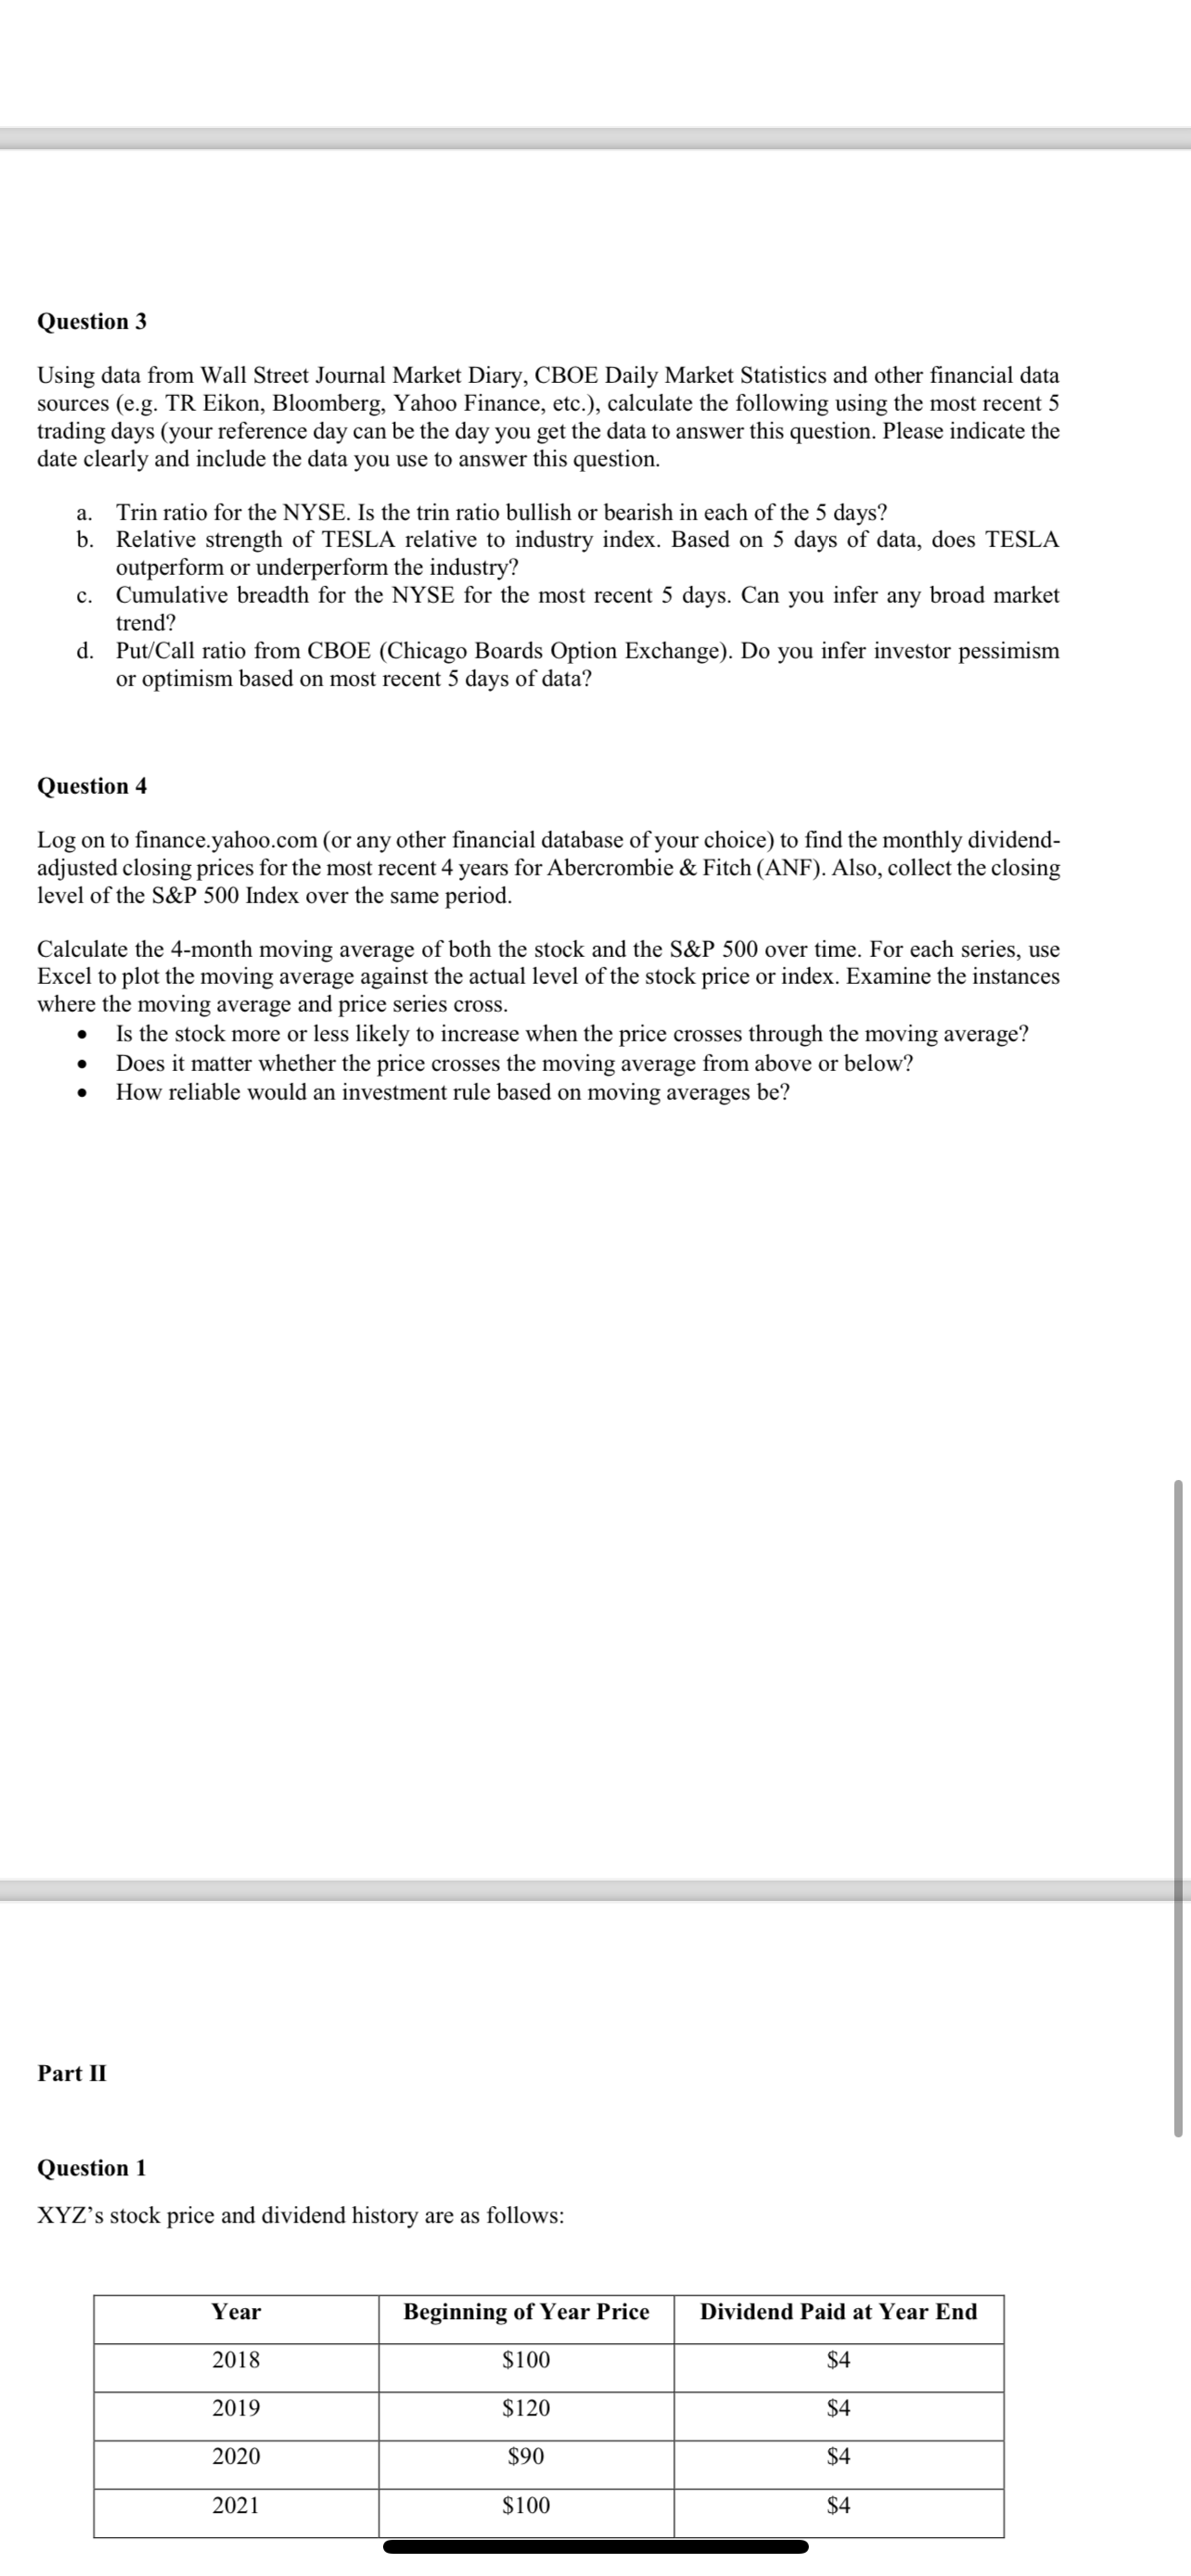
XYZs stock price and dividend history are as follows:
Step by Step Solution
There are 3 Steps involved in it
1 Expert Approved Answer
Step: 1 Unlock

Question Has Been Solved by an Expert!
Get step-by-step solutions from verified subject matter experts
Step: 2 Unlock
Step: 3 Unlock