

Question: Question 31 The frequency distribution in the table represents the square footage of a random sample of 496 houses that are owner occupied year round.
Question 31
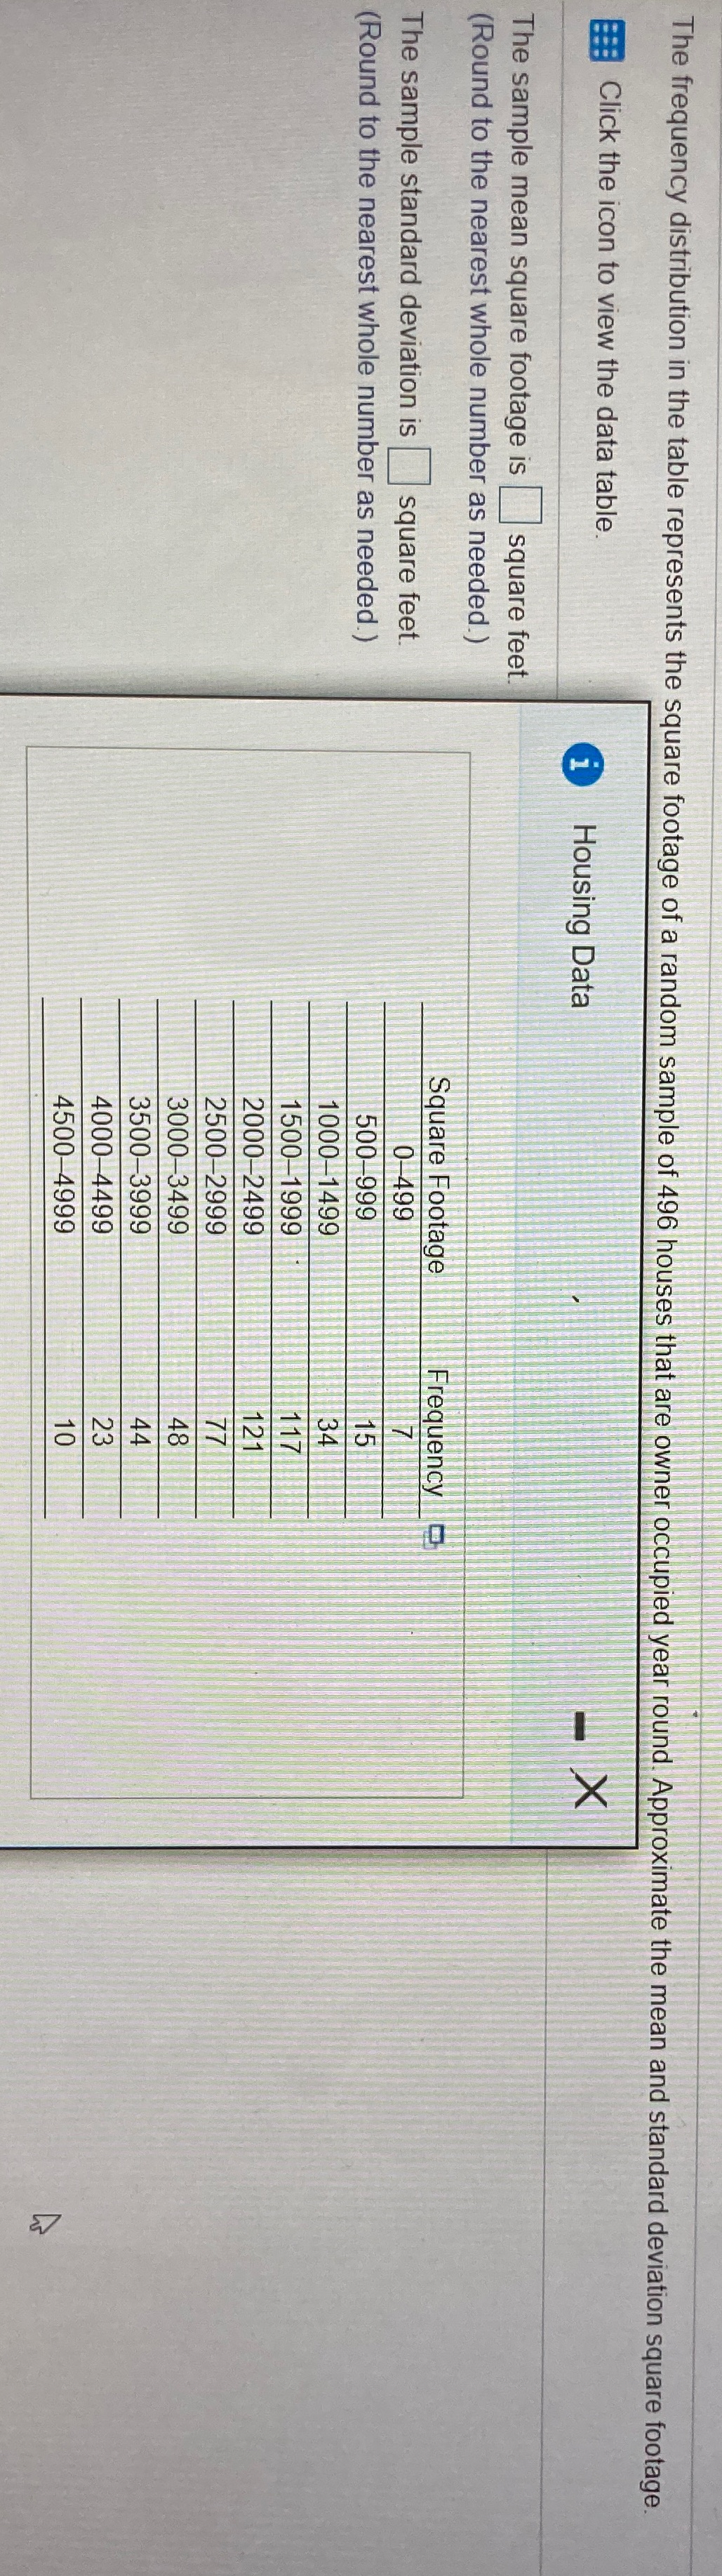
The frequency distribution in the table represents the square footage of a random sample of 496 houses that are owner occupied year round. Approximate the mean and standard deviation square footage. Click the icon to view the data table. i Housing Data X The sample mean square footage is |square feet. (Round to the nearest whole number as needed.) Square Footage Frequency The sample standard deviation is square feet. 0-499 (Round to the nearest whole number as needed.) 500-999 1000-1499 1500-1999 2000-2499 2500-2999 3000-3499 3500-3999 4000-4499 4500-4999
Step by Step Solution
There are 3 Steps involved in it
1 Expert Approved Answer
Step: 1 Unlock

Question Has Been Solved by an Expert!
Get step-by-step solutions from verified subject matter experts
Step: 2 Unlock
Step: 3 Unlock