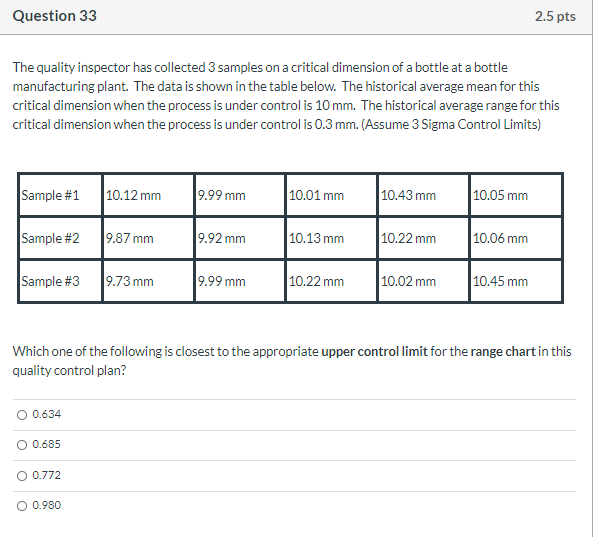
Question: Question 33 2.5 pts The quality inspector has collected 3 samples on a critical dimension of a bottle at a bottle manufacturing plant. The data

Question 33 2.5 pts The quality inspector has

Question 33 2.5 pts The quality inspector has collected 3 samples on a critical dimension of a bottle at a bottle manufacturing plant. The data is shown in the table below. The historical average mean for this critical dimension when the process is under control is 10 mm. The historical average range for this critical dimension when the process is under control is 0.3 mm. (Assume 3 Sigma Control Limits) Sample #1 10.12 mm 19.99 mm 10.01 mm 10.43 mm 10.05 mm Sample #2 9.87 mm 0.92 mm 10.13 mm 10.22 mm 10.06 mm Sample #3 19.73 mm 19.99 mm 10.22 mm 10.02 mm 10.45 mm Which one of the following is closest to the appropriate upper control limit for the range chart in this quality control plan? 0.634 0.685 O 0.772 O 0.980

Step by Step Solution

There are 3 Steps involved in it

1 Expert Approved Answer
Step: 1 Unlock blur-text-image
Question Has Been Solved by an Expert!

Get step-by-step solutions from verified subject matter experts

Step: 2 Unlock
Step: 3 Unlock

Students Have Also Explored These Related General Management Questions!