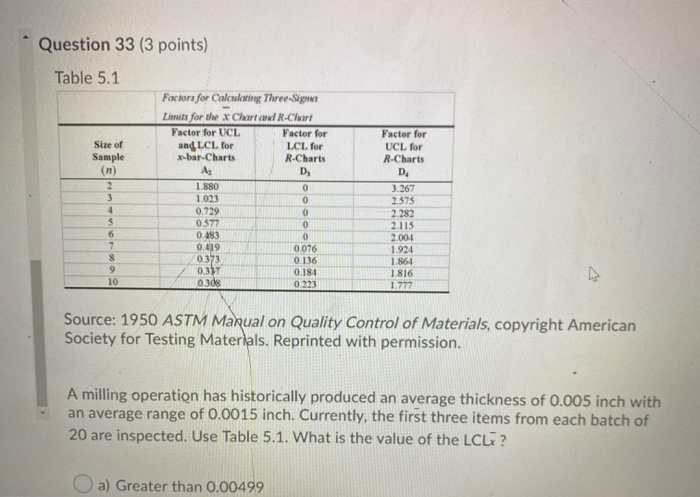
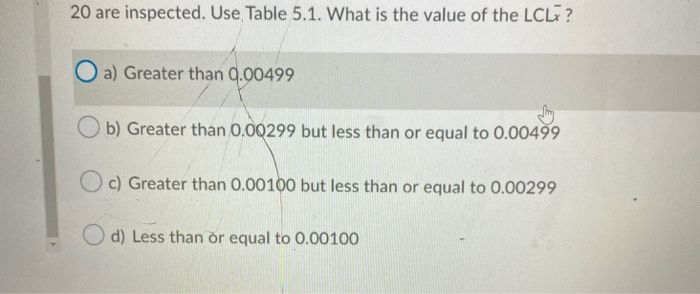
Question: Question 33 (3 points) Table 5.1 Size of Sample (n) 2 3 4 S 6 7 8 9 10 Factors for Calculating Three-Sigma Limits for

Question 33 (3 points) Table 5.1 Size of Sample
Question 33 (3 points) Table 5.1 Size of Sample (n) 2 3 4 S 6 7 8 9 10 Factors for Calculating Three-Sigma Limits for the x Chart and R-Chart Factor for UCL Factor for and LCL for LCL for x-bar-Charts R-Charts A: D, 1.880 0 1.023 0 0.729 0 0577 0 0.483 0.419 0.076 0373 0.136 0337 0.184 0308 0.223 Factor for UCL for R-Charts D. 3.267 2.575 2.282 2.115 2.004 1.924 1.864 1.816 1.777 0 Source: 1950 ASTM Manual on Quality Control of Materials, copyright American Society for Testing Materials. Reprinted with permission. A milling operation has historically produced an average thickness of 0.005 inch with an average range of 0.0015 inch. Currently, the first three items from each batch of 20 are inspected. Use Table 5.1. What is the value of the LCLT? a) Greater than 0.00499 20 are inspected. Use Table 5.1. What is the value of the LCLE? O a) Greater than 0.00499 Ob) Greater than 0.00299 but less than or equal to 0.00499 O c) Greater than 0.00100 but less than or equal to 0.00299 d) Less than or equal to 0.00100

Step by Step Solution

There are 3 Steps involved in it

1 Expert Approved Answer
Step: 1 Unlock blur-text-image
Question Has Been Solved by an Expert!

Get step-by-step solutions from verified subject matter experts

Step: 2 Unlock
Step: 3 Unlock

Students Have Also Explored These Related General Management Questions!