

Question: Question 35 2. Use the AICPA Attribute Statistical Sampling Tables for a 5% risk of setting control risk too low listed below to answer the
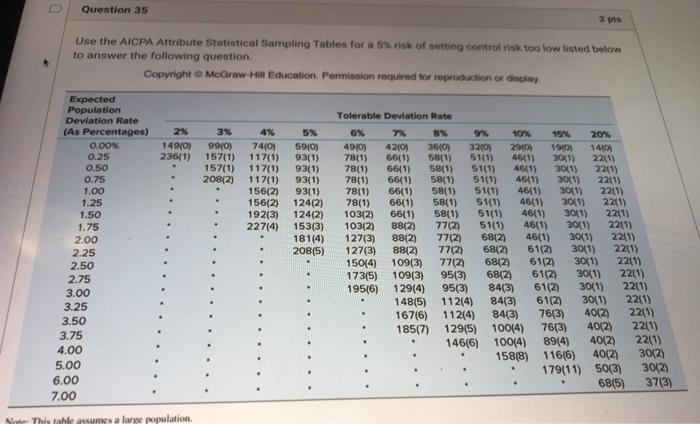
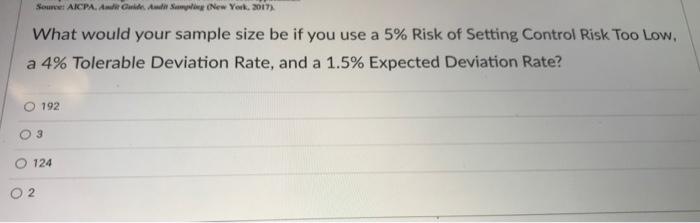
Question 35 2. Use the AICPA Attribute Statistical Sampling Tables for a 5% risk of setting control risk too low listed below to answer the following question Copyright McGraw.Hm Education. Permission required for reproduction or dechy, 2% 149(0) 236(1) 3M 99(0) 157(1) 157(1) 208(2) 4% 74(0) 117(1) 117(1) 117(1) 156(2) 156(2) 192(3) 227(4) Expected Population Deviation Rate (As Percentages) 0.00% 0.25 0.50 0.75 1.00 1.25 1.50 1.75 2.00 2.25 2.50 2.75 3.00 3.25 3.50 3.75 4.00 5.00 6.00 7.00 5% 590) 93(1) 93(1) 93(1) 93(1) 124(2) 124(2) 153(3) 181(4) 208(5) Tolerable Deviation Rate 6% B% 9% 10% 20% 4910) 4210 3610) 3210 2910 1910) 1410 78(1) 66(1) 58411 51(1) 4641) 3041) 2241) 78(1) 6611) 58(1) 51(1) 464) 3041) 2241 78(1) 66(1) 5841) 51(1) 4641) 30(1) 2211) 78(1) 66(1) 581) 51(1) 46(1) 3041) 2241) 78(1) 66(1) 58(1) 51(1) 46(1) 3011) 2210) 103(2) 66(1) 58(1) 51(0) 46(1) 3011) 22(1) 103(2) 88(2) 77(2) 51(1) 46(1) 30(1) 22(1) 127(3) 8812) 77121 6842) 46(1) 3041) 2211) 127(3) 88(2) 77(2) 6812) 6112) 30(1) 2211) 150(4) 109(3) 77129 6812) 61(2) 3011) 2211) 173(5) 109(3) 95(3) 68(2) 61(2) 3011) 2211) 195(6) 129(4) 95(3) 84(3) 6112) 30(1) 2211) 148(5) 112(4) 84(3) 6112) 30(1) 2211) 167(6) 112(4) 84(3) 76(3) 4012) 2241 185(7) 129(5) 100(4) 76(3) 40121 2211) 146(6) 100[4) 89(4) 40121 2211) 158(8) 116(6) 4012) 3012) 179(11) 50(3) 3012) 37(3) 6815) Note This tahes assumes a large population Source: AICPA. A Guide All Sam New York, 2017) What would your sample size be if you use a 5% Risk of Setting Control Risk Too Low, a 4% Tolerable Deviation Rate, and a 1.5% Expected Deviation Rate? 192 3 124
Step by Step Solution
There are 3 Steps involved in it

Get step-by-step solutions from verified subject matter experts