

Question: Use the AICPA Attribute Statistical Sampling Tables linked here to answer the following question Copyright McGraw-Hill Education Permission required for reproduction of the Actual Number
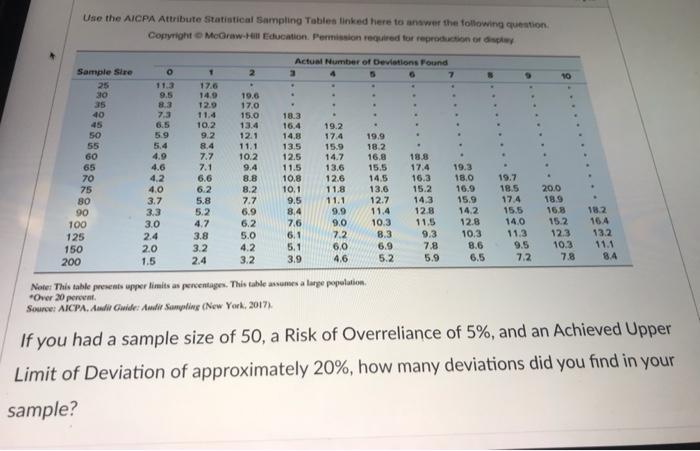
Use the AICPA Attribute Statistical Sampling Tables linked here to answer the following question Copyright McGraw-Hill Education Permission required for reproduction of the Actual Number of Deviations Found o 2 10 Sample Sire 25 30 35 40 1 17.6 14.9 12.9 11.4 10.2 9.2 8.4 19.6 17.0 15.0 13.4 12.1 11.1 10.2 9.4 8.8 8.2 7.7 9.5 8.3 7.3 6.5 5.9 5.4 4.9 4.6 4.2 4.0 3.7 3.3 3.0 2.4 2.0 1.5 50 55 60 65 70 75 80 90 100 125 150 200 18.3 16.4 14.8 13.5 12.5 11.5 10.8 10.1 9.5 8.4 7.6 6.1 5.1 3.9 7.1 6.6 6.2 5.8 5.2 4.7 3.8 3.2 2.4 19.2 17.4 15.9 14.7 13.6 12.6 11.8 11.1 9.9 9.0 7.2 6.0 4.6 19.9 18.2 16.0 15.5 14.5 13.6 12.7 11.4 10.3 8.3 6.9 7.7 6.9 6.2 5.0 4.2 3.2 18.3 17.4 16.3 15.2 14.3 128 11.5 9.3 7.8 5.9 19.3 18.0 16.9 15.9 14.2 12.8 10.3 8.6 6.5 19.7 18.5 17.4 15.5 140 11.3 9.5 7.2 20.0 18.9 168 15.2 123 10.3 78 182 164 13.2 11.1 8.4 5.2 Note: This table presents upper limits as percentages. This table assumes a large population Over 20 percent Source: AICPA. Andi Guide: Andir Sampling (New York, 2017), If you had a sample size of 50, a Risk of Overreliance of 5%, and an Achieved Upper Limit of Deviation of approximately 20%, how many deviations did you find in your sample? sample: 04 O 5 06 O 7
Step by Step Solution
There are 3 Steps involved in it

Get step-by-step solutions from verified subject matter experts