

Question: Question 38 2.5 pts According to the graph below, what is your estimate of P&G's net income in the most recent fiscal year? Assume that
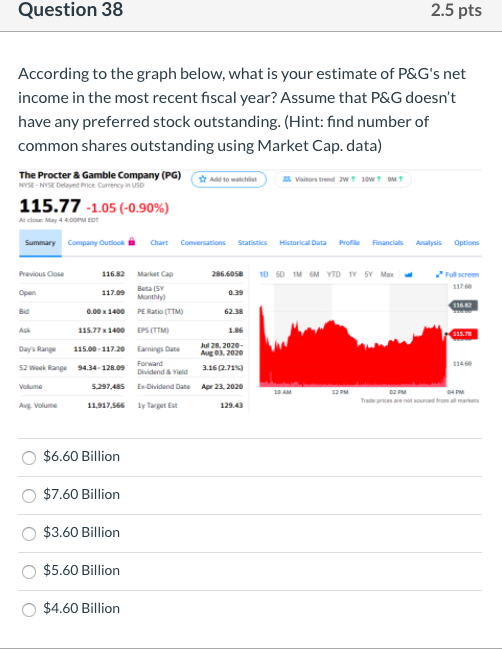
Question 38 2.5 pts According to the graph below, what is your estimate of P&G's net income in the most recent fiscal year? Assume that P&G doesn't have any preferred stock outstanding. (Hint: find number of common shares outstanding using Market Cap. data) The Procter & Gamble Company (PG) Add to run w ww NYENYE Device mency in USD 115.77 -1.05 (-0.90%) At die May 44:OPM EDT Summary Company Outlook Chart Conversations Statistics Historical Data Profile Financial Analysis Options Previous Close 116.82 Cap 286.6058 10 50 M M YTD TYY Mas Pullscreen 1176 117.09 Beta (SY Monthly PE Ratio (TTM) 0.00 x 1400 62.39 115.77 x 1400 EPS (TTM) Days Range 52 Week Range Earnings Date Forward Jul 28, 2020- Aug 01. 20:20 3.162.734 115.00-117.20 94.34-128.09 5.297,485 11,917,566 Dividend Yield Volume Apr 23, 2020 Ex-Dividend Date 1y Target Est Ang Volume 129.43 $6.60 Billion $7.60 Billion $3.60 Billion $5.60 Billion $4.60 Billion
Step by Step Solution
There are 3 Steps involved in it

Get step-by-step solutions from verified subject matter experts