

Question: Question 4 (10 points) Scenario #4 - The last several charts have been showing story point burn down. This is a burn up chart. Explain
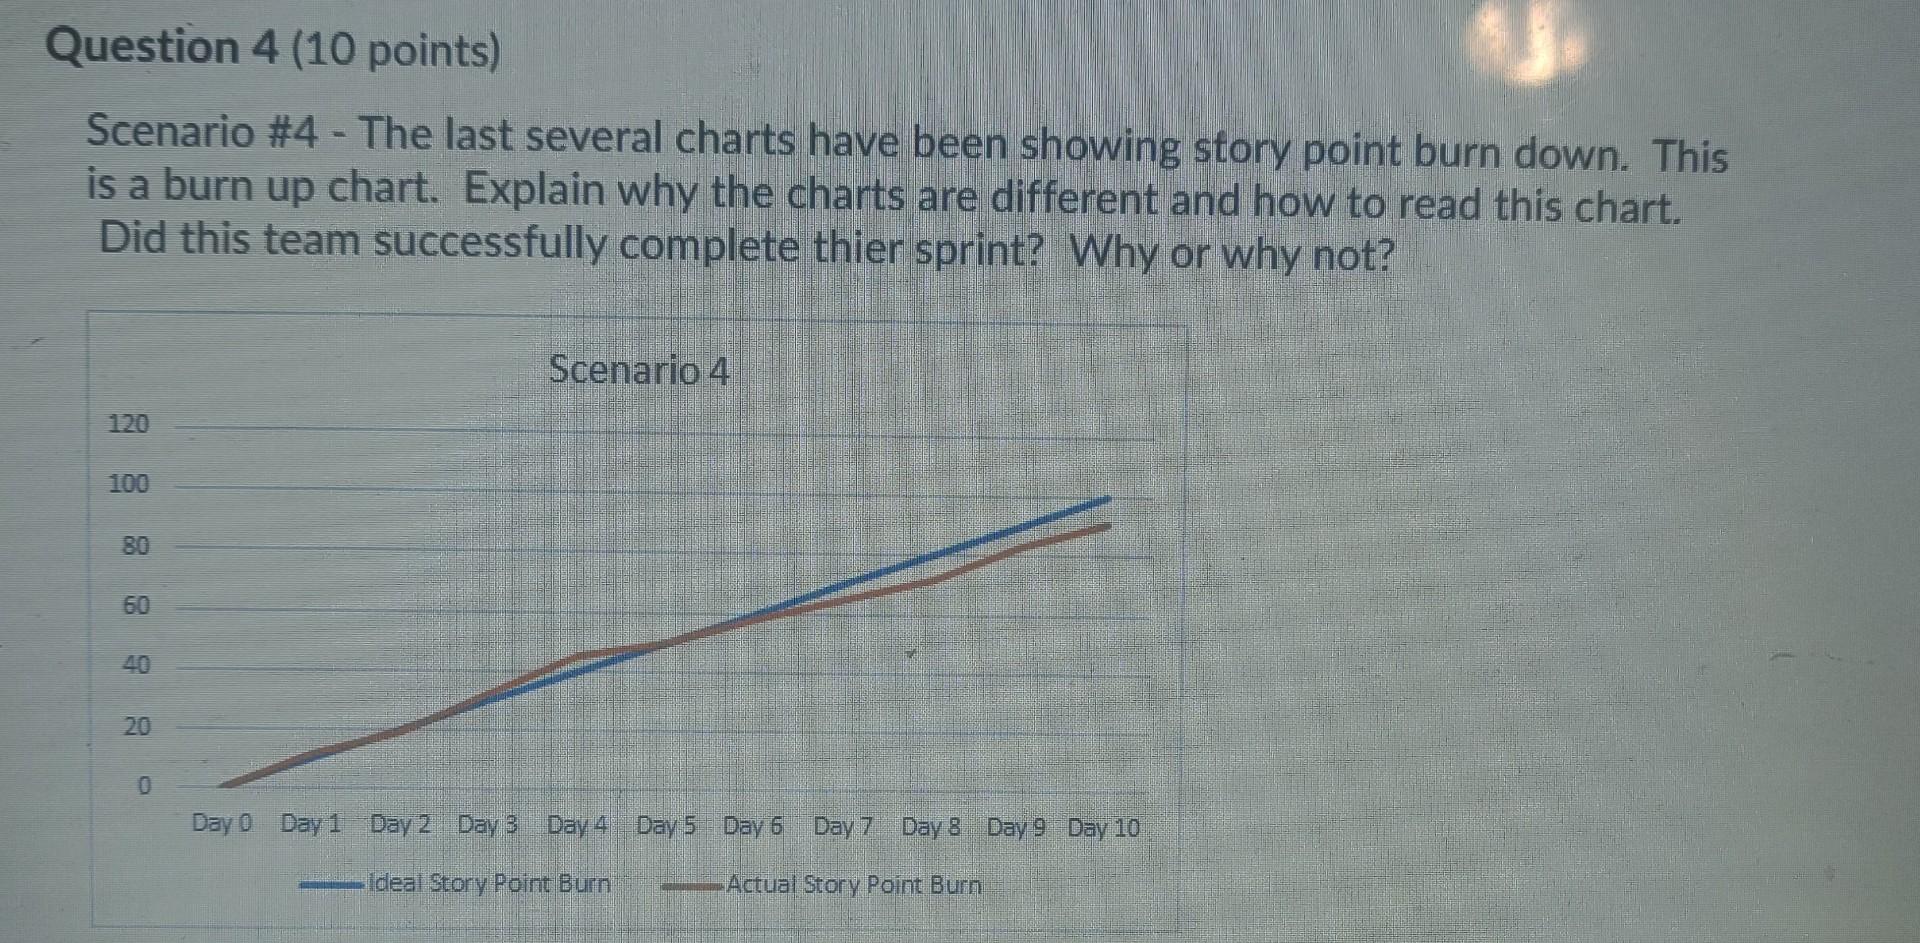
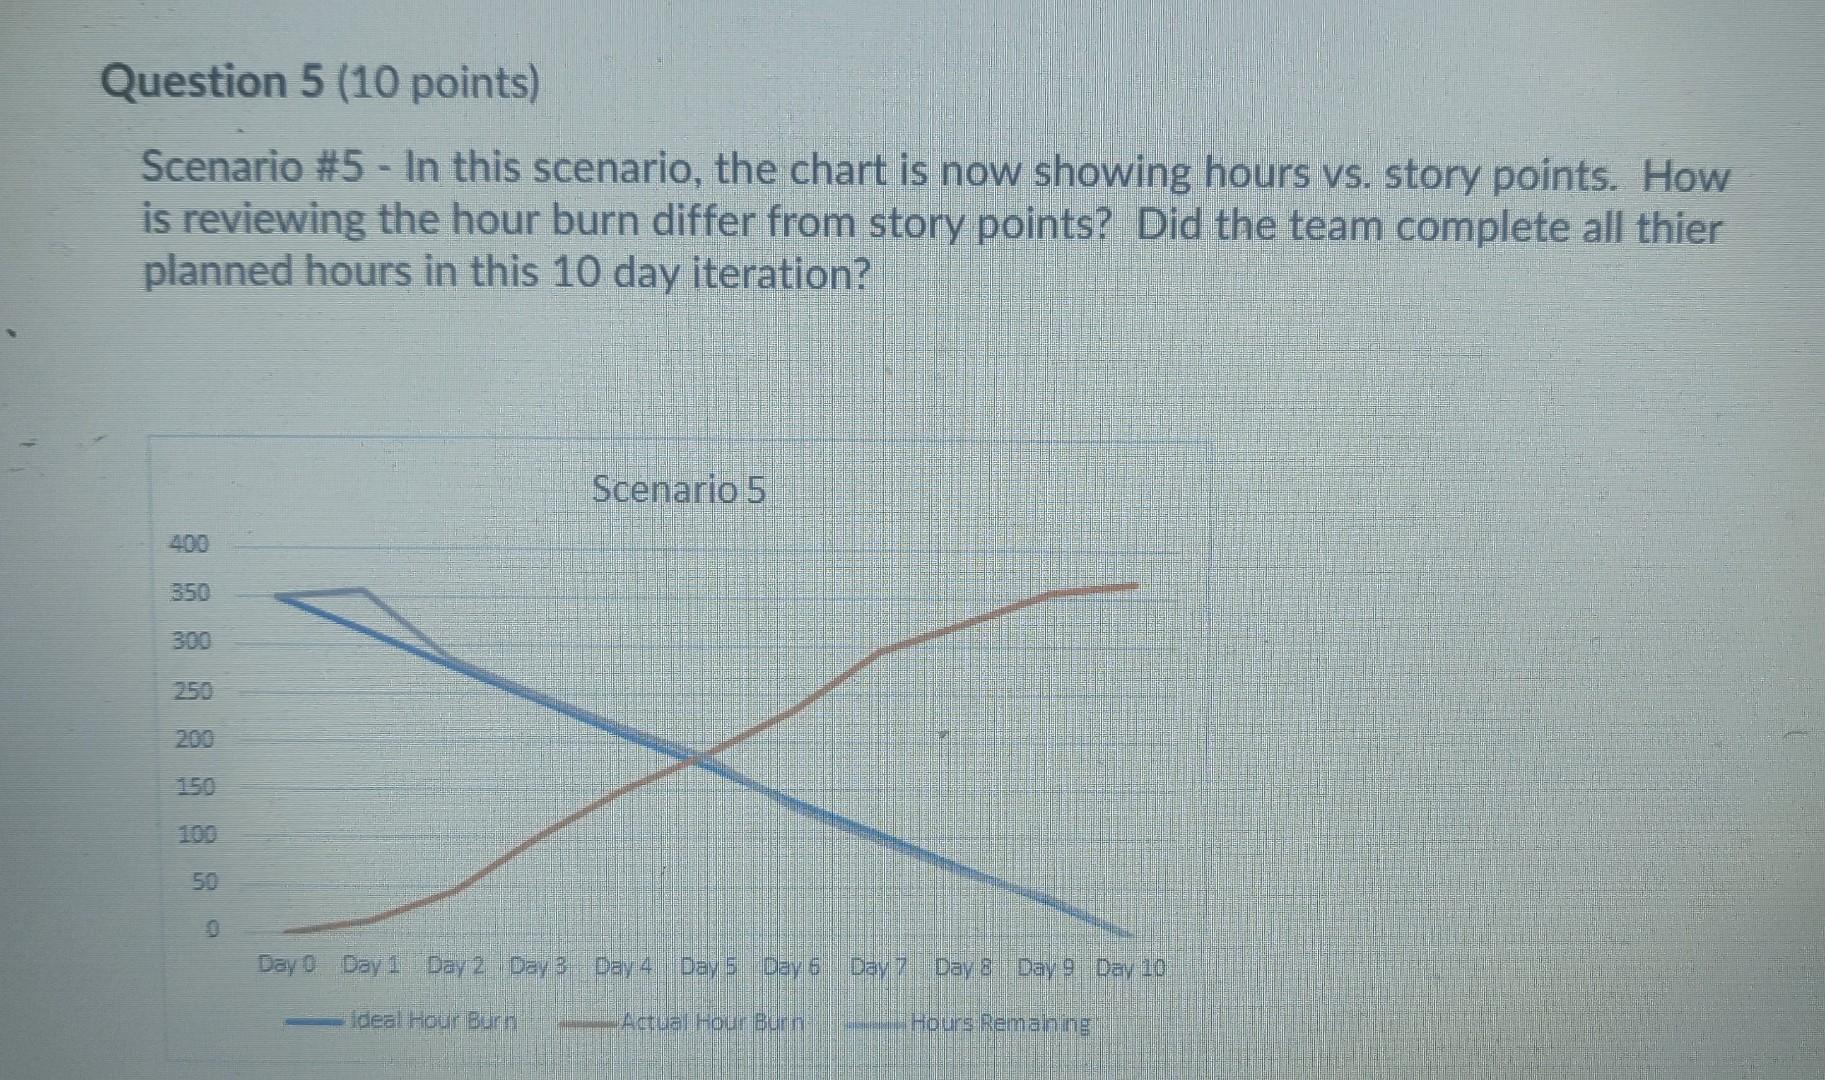
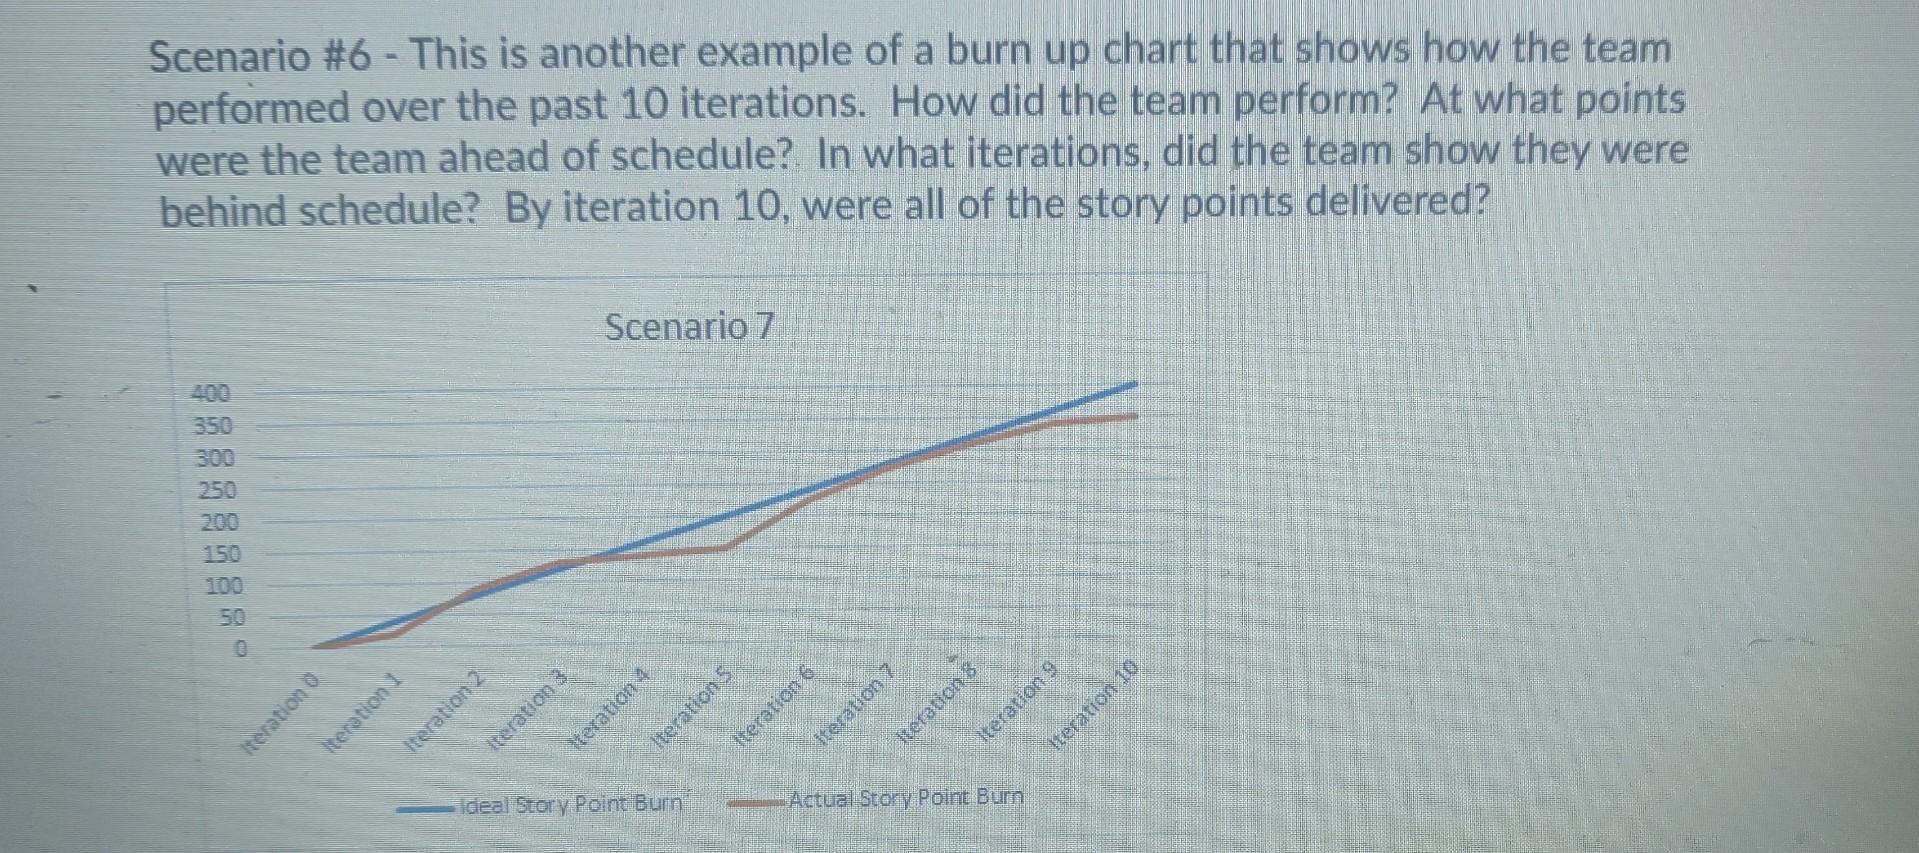
Question 4 (10 points) Scenario #4 - The last several charts have been showing story point burn down. This is a burn up chart. Explain why the charts are different and how to read this chart. Did this team successfully complete thier sprint? Why or why not? Scenario 4 100 80 60 40 20 Day 0 Day 1 Day 2 Day 3 Day 4 Day 5 Day 6 Day 7 Day 8 Day 9 Day 10 ideal Story Point Burn Actual Story Point Burn Question 5 (10 points) Scenario #5 - In this scenario, the chart is now showing hours vs. story points. How is reviewing the hour burn differ from story points? Did the team complete all thier planned hours in this 10 day iteration? Scenario 5 350 300 150 50 Day 0 Day 1 Day 2 Day 3 Day 4 Day 5 Day 6 Day 7 Day 3 Day 2 Day 10 ideal Hour sur ARLA HOBorn Hours Remaining Scenario #6 - This is another example of a burn up chart that shows how the team performed over the past 10 iterations. How did the team perform? At what points were the team ahead of schedule? In what iterations, did the team show they were behind schedule? By iteration 10, were all of the story points delivered? Scenario 7 300 250 150 100 50 Iteration 0 iteration 3 zuonej uoperasi tuoneen Iterations Iteration 6 iteration 2 retation 8 Beration 9 iteration 10 Ideal Story Point Burn Actual Story Point Burn Question 7 (10 points) Research online for some additional examples of burndown or burn up charts that you think would be helpful when managing agile teams or projects. 1) Provide at least two examples in your response with a link to there URLs. 2) Explain what you like and don't like with the examples you find
Step by Step Solution
There are 3 Steps involved in it
1 Expert Approved Answer
Step: 1 Unlock

Question Has Been Solved by an Expert!
Get step-by-step solutions from verified subject matter experts
Step: 2 Unlock
Step: 3 Unlock