

Question: Question 4 [11 marks] The data below shows car model and the color of vehicles sold at a Car dealership. Hyundai Honda Toyota Daihatsu Subaru
![Question 4 [11 marks] The data below shows car model and](https://s3.amazonaws.com/si.experts.images/answers/2024/06/6673cc43715db_9636673cc4321e50.jpg)
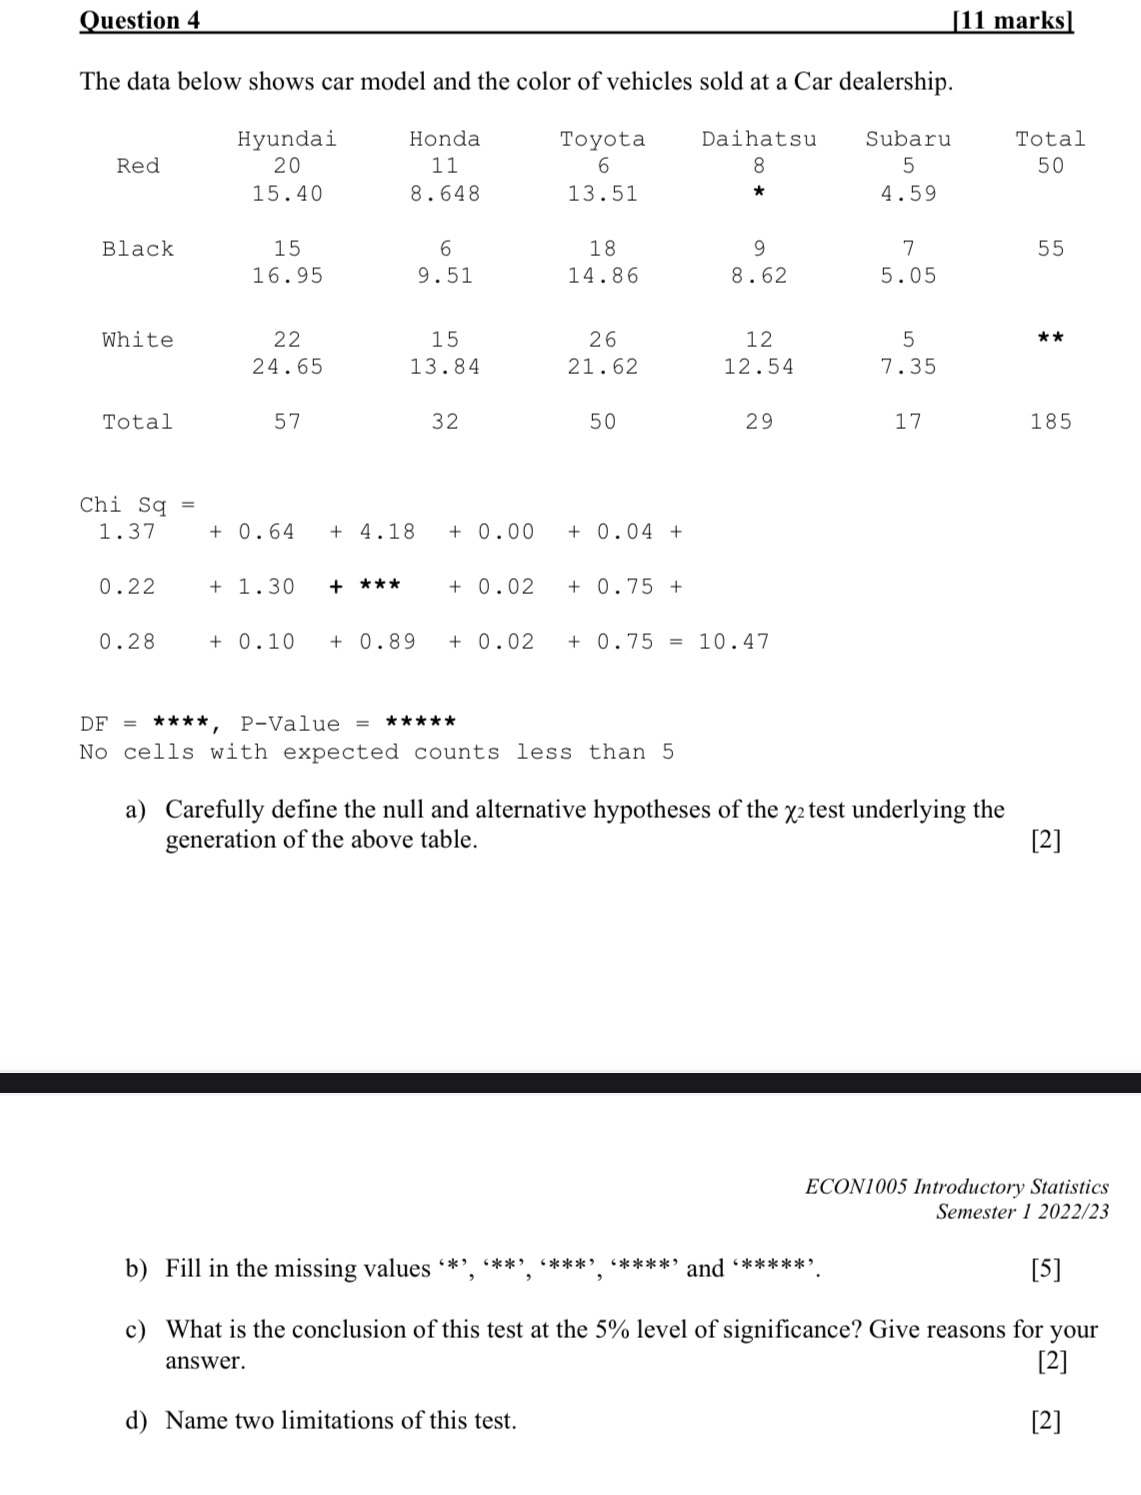
Question 4 [11 marks] The data below shows car model and the color of vehicles sold at a Car dealership. Hyundai Honda Toyota Daihatsu Subaru Total Red 20 11 6 8 5 50 15 . 40 8 . 648 13 . 51 * 4.59 Black 15 6 18 9 7 55 16.95 9. 51 14. 86 8 . 62 5 . 05 White 22 15 26 12 5 24. 65 13.84 21 . 62 12 . 54 7. 35 Total 57 32 50 29 17 185 Chi Sq = 1. 37 + 0. 64 + 4.18 + 0. 00 + 0. 04 + 0. 22 + 1.30 + * * * + 0. 02 + 0. 75 + 0. 28 + 0. 10 + 0. 89 + 0. 02 + 0. 75 = 10.47 OF = * * **, P-Value = ***** No cells with expected counts less than 5 a) Carefully define the null and alternative hypotheses of the x2 test underlying the generation of the above table. [2] ECON1005 Introductory Statistics Semester 1 2022/23 b) Fill in the missing values "*, '**', '***', '****' and '*****' [5] c) What is the conclusion of this test at the 5% level of significance? Give reasons for your answer. [2] d) Name two limitations of this test. [2]
Step by Step Solution
There are 3 Steps involved in it

Get step-by-step solutions from verified subject matter experts