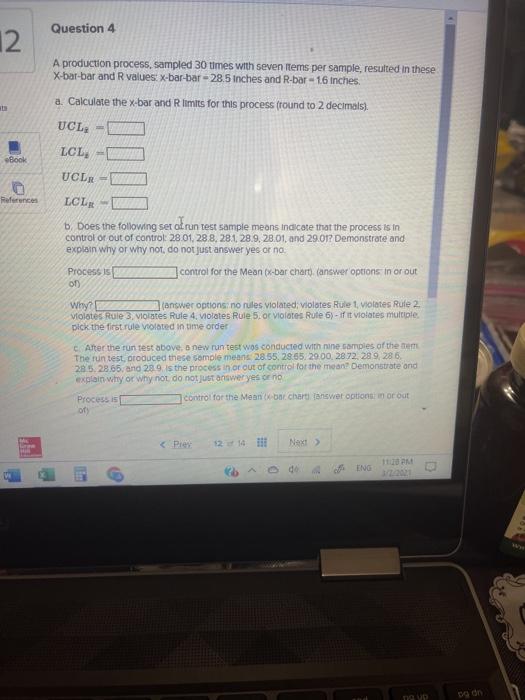
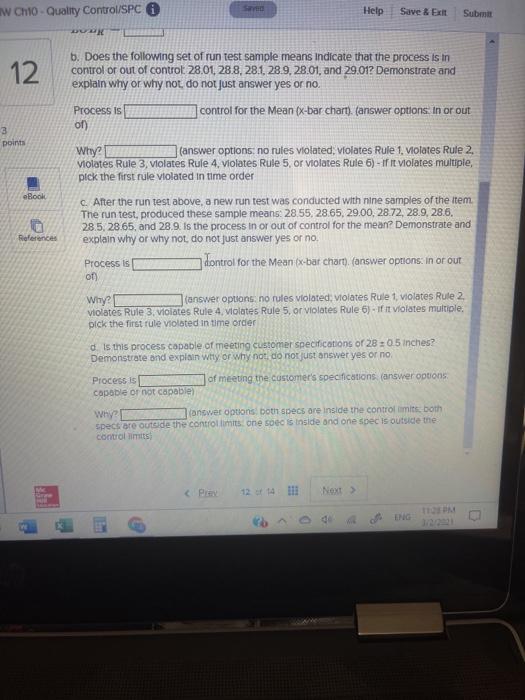
Question: Question 4 12 A production process, sampled 30 times with seven Items per sample, resulted in these X-bar-bar and R values: x-bar-bar - 28.5 inches

Question 4 12 A production process, sampled 30
Question 4 12 A production process, sampled 30 times with seven Items per sample, resulted in these X-bar-bar and R values: x-bar-bar - 28.5 inches and R-bar - 16 inches. a. Calculate the x-bar and R limits for this process (round to 2 decimals). UCL LCL Book UCLR- References LCLR d. Does the following set of run test sample means indicate that the process is in control or out of control: 28.01.28.8, 281, 28.9, 28.01. and 29.017 Demonstrate and explain why or why not, do not just answer yes or no Process control for the Mean x-bar chart (answer options in or out 01 Why (answer options: no rules violated violates Rule 1. violates Rule 2 violates Rule 3, Violates Rule 4. violates Rule 5. or violates Rule 6) - if it violates multiple pick the first rule violated in time order Arter the run test above, new run test wos conducted with nine samples of them The run test produced these complement 28.55 2865, 2000, 2872, 289, 286. 28 5.28 65 and 28 9 Is the process in or out of control for the mean? Demonstrate and explain why or why not do not just answer yes or no Process is control for the Moon - chart answer options in or out of

Step by Step Solution

There are 3 Steps involved in it

1 Expert Approved Answer
Step: 1 Unlock blur-text-image
Question Has Been Solved by an Expert!

Get step-by-step solutions from verified subject matter experts

Step: 2 Unlock
Step: 3 Unlock

Students Have Also Explored These Related General Management Questions!