

Question: QUESTION 4 4 . 1 For the past 6 days, data was taken ( in Hundreds ) for the Covid Omicron infection rates in three
QUESTION
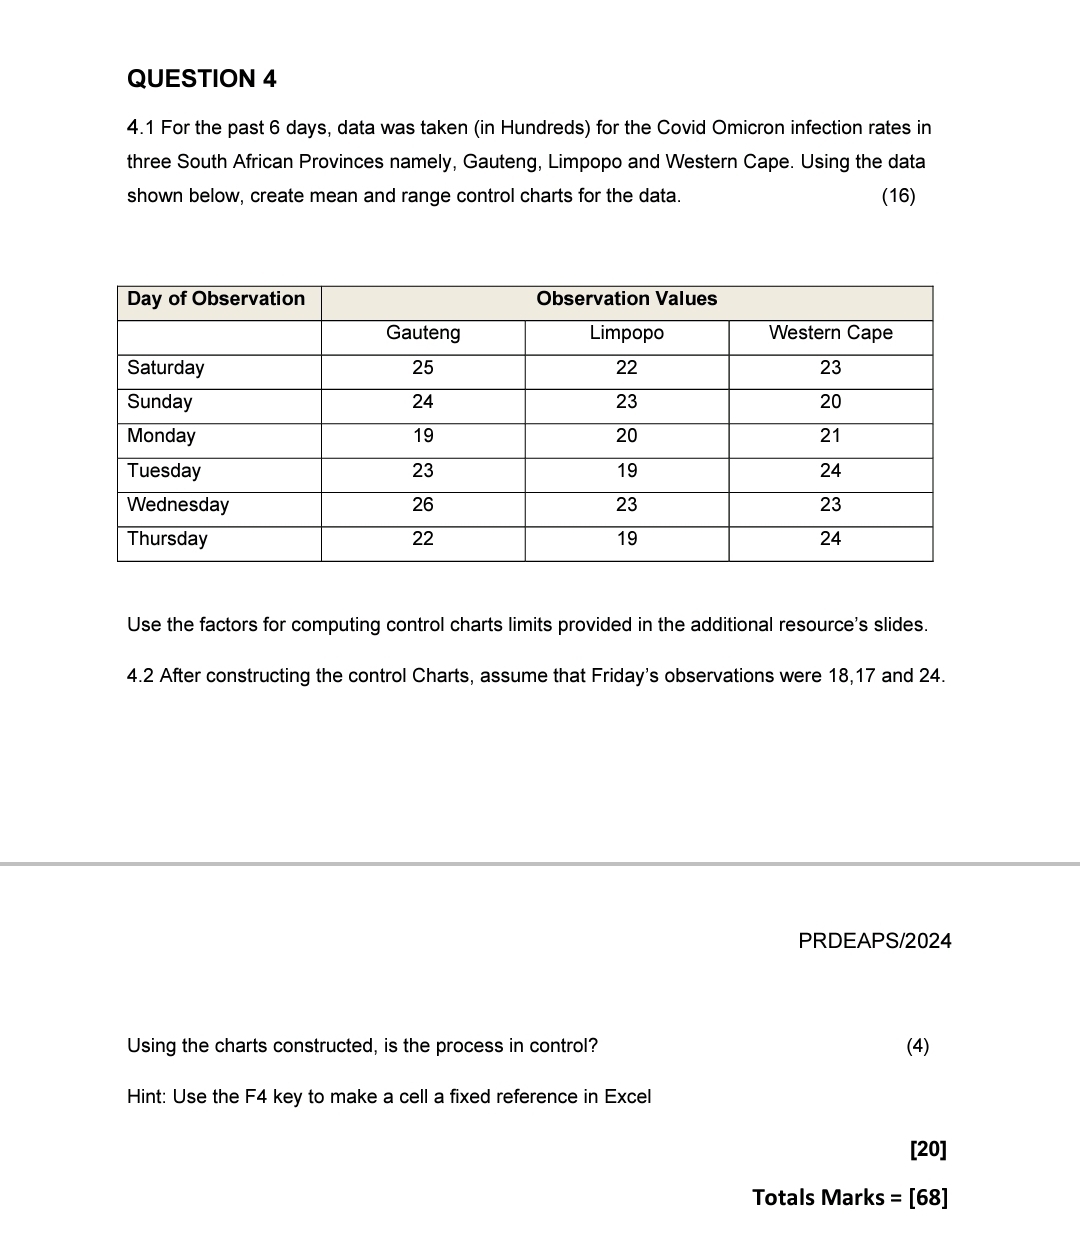
For the past days, data was taken in Hundreds for the Covid Omicron infection rates in three South African Provinces namely, Gauteng, Limpopo and Western Cape. Using the data shown below, create mean and range control charts for the data.
tableDay of Observation,Observation ValuesGauteng,Limpopo,Western CapeSaturdaySundayMondayTuesdayWednesdayThursday
Use the factors for computing control charts limits provided in the additional resource's slides.
After constructing the control Charts, assume that Friday's observations were and
PRDEAPS
Using the charts constructed, is the process in control?
Hint: Use the F key to make a cell a fixed reference in Excel
Totals Marks
Step by Step Solution
There are 3 Steps involved in it
1 Expert Approved Answer
Step: 1 Unlock

Question Has Been Solved by an Expert!
Get step-by-step solutions from verified subject matter experts
Step: 2 Unlock
Step: 3 Unlock