

Question: can i get a clear and detailed answer PRDEAPS/2022 QUESTION 1 1.1 For the past 6 days, data was taken (in Hundreds) for the Covid
can i get a clear and detailed answer 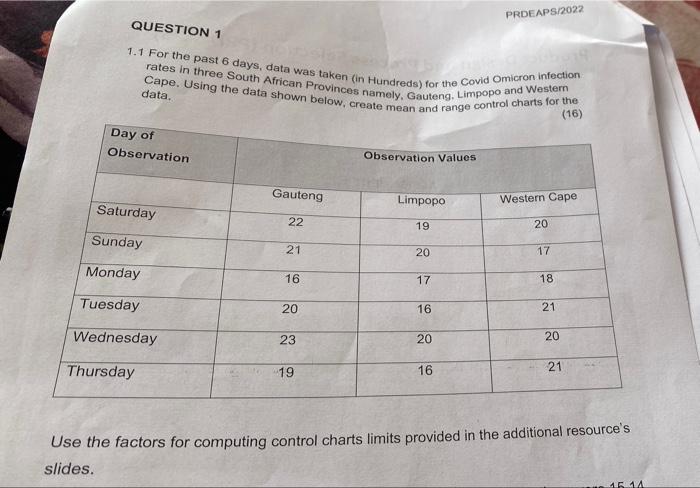
PRDEAPS/2022 QUESTION 1 1.1 For the past 6 days, data was taken (in Hundreds) for the Covid Omicron infection rates in three South African Provinces namely, Gauteng, Limpopo and Western Cape. Using the data shown below, create mean and range control charts for the data. (16) Day of Observation Observation Values Gauteng Limpopo Western Cape Saturday 22 19 20 Sunday 21 17 20 Monday 16 17 Tuesday 20 16 Wednesday 23 20 21 Thursday 19 16 Use the factors for computing control charts limits provided in the additional resource's slides. 15 14 18 21 20 Step by Step Solution
There are 3 Steps involved in it
1 Expert Approved Answer
Step: 1 Unlock

Question Has Been Solved by an Expert!
Get step-by-step solutions from verified subject matter experts
Step: 2 Unlock
Step: 3 Unlock