

Question: QUESTION 4 4 A p - chart a . counts the number of non - conformances per unit b . can have negative lower limits
QUESTION
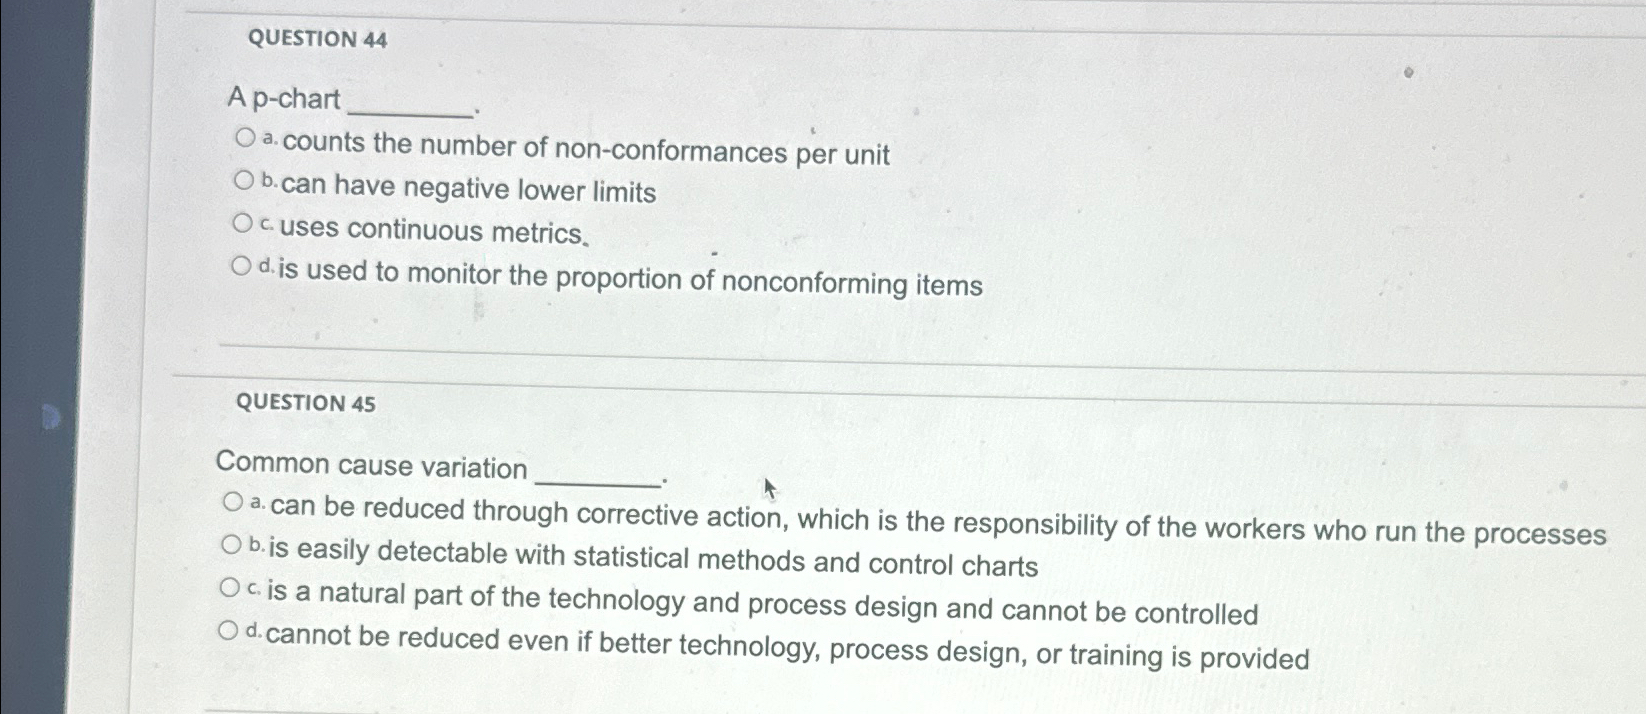
A pchart
a counts the number of nonconformances per unit
b can have negative lower limits
c uses continuous metrics.
d is used to monitor the proportion of nonconforming items
QUESTION
Common cause variation
a can be reduced through corrective action, which is the responsibility of the workers who run the processes
b is easily detectable with statistical methods and control charts
c is a natural part of the technology and process design and cannot be controlled
d cannot be reduced even if better technology, process design, or training is provided
Step by Step Solution
There are 3 Steps involved in it
1 Expert Approved Answer
Step: 1 Unlock

Question Has Been Solved by an Expert!
Get step-by-step solutions from verified subject matter experts
Step: 2 Unlock
Step: 3 Unlock