

Question: Question 4 a). b). One graph in the figure represents a normal distribution with mean = 6 and standard deviation o = 2. The other
Question 4
a).
 b).
b).
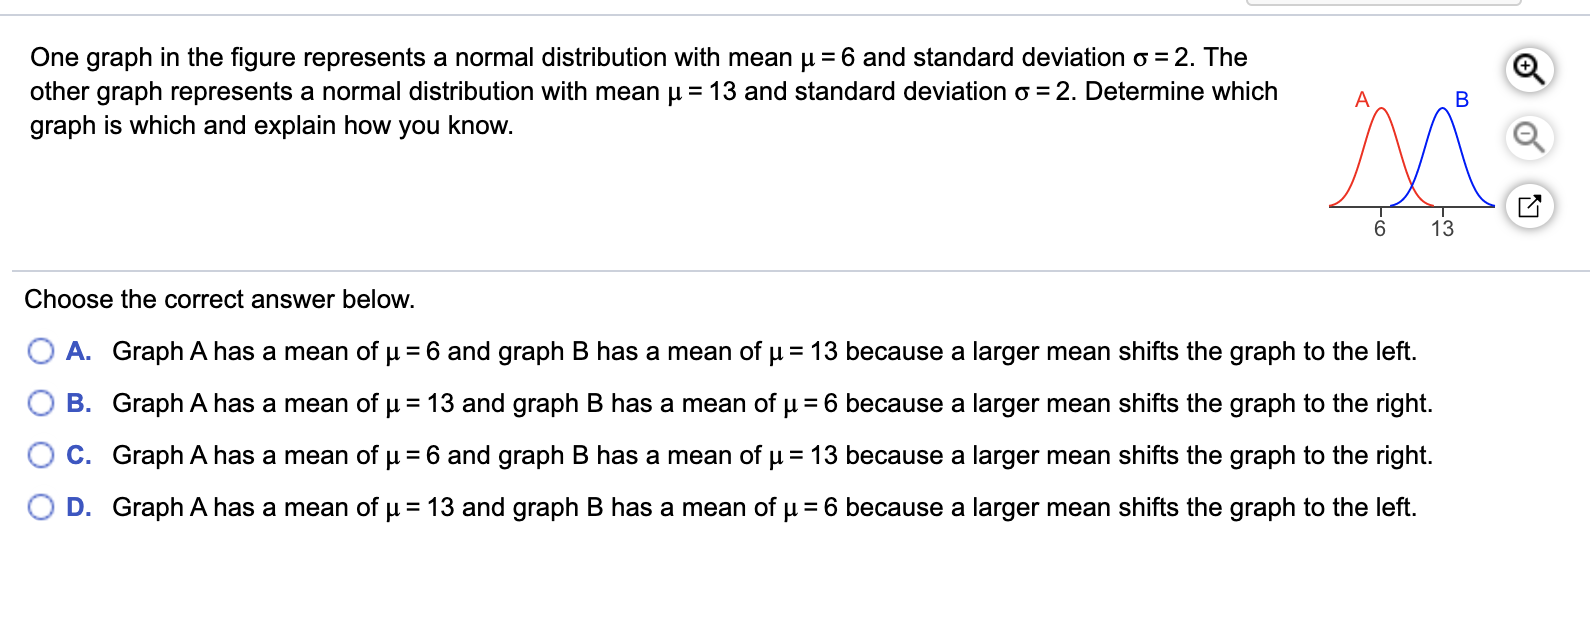
One graph in the figure represents a normal distribution with mean = 6 and standard deviation o = 2. The other graph represents a normal distribution with mean = 13 and standard deviation o = 2. Determine which graph is which and explain how you know. A B Ma 6 13 Choose the correct answer below. A. Graph A has a mean of = 6 and graph B has a mean of = 13 because a larger mean shifts the graph to the left. B. Graph A has a mean of = 13 and graph B has a mean of = 6 because a larger mean shifts the graph to the right. C. Graph A has a mean of = 6 and graph B has a mean of = 13 because a larger mean shifts the graph to the right. D. Graph A has a mean of = 13 and graph B has a mean of = 6 because a larger mean shifts the graph to the left.
Step by Step Solution
3.39 Rating (149 Votes )
There are 3 Steps involved in it
The link to the Z s... View full answer

Get step-by-step solutions from verified subject matter experts