

Question: Question 4 a) Consider the following information: State Probability ABC Inc.'s Return Boom 0.25 15% Normal 0.50 8% Slowdown 0.15 4% Recession 0.10 -3%
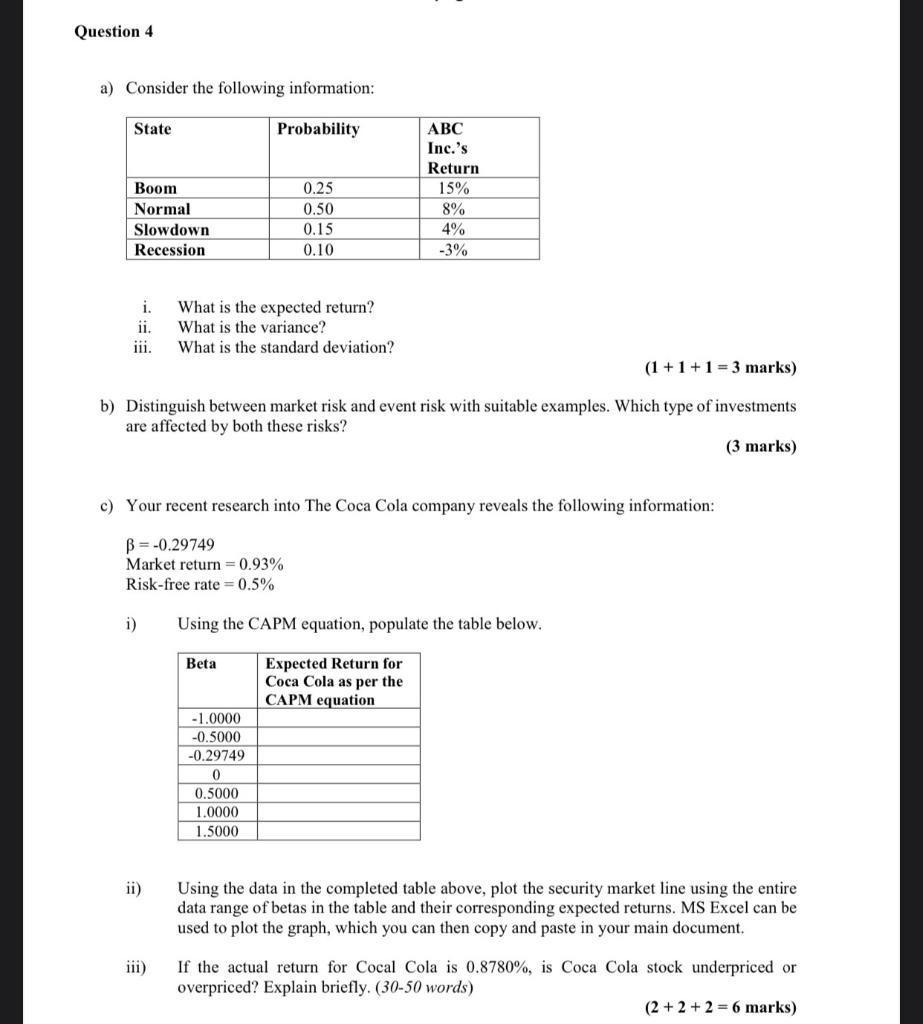
Question 4 a) Consider the following information: State Probability ABC Inc.'s Return Boom 0.25 15% Normal 0.50 8% Slowdown 0.15 4% Recession 0.10 -3% i. What is the expected return? ii. What is the variance? What is the standard deviation? (1+1+1=3 marks) b) Distinguish between market risk and event risk with suitable examples. Which type of investments are affected by both these risks? c) Your recent research into The Coca Cola company reveals the following information: B=-0.29749 Market return 0.93% Risk-free rate=0.5% i) Using the CAPM equation, populate the table below. Beta -1.0000 -0.5000 Expected Return for Coca Cola as per the CAPM equation -0.29749 0 0.5000 1.0000 1.5000 -- (3 marks) ii) iii) Using the data in the completed table above, plot the security market line using the entire data range of betas in the table and their corresponding expected returns. MS Excel can be used to plot the graph, which you can then copy and paste in your main document. If the actual return for Cocal Cola is 0.8780%, is Coca Cola stock underpriced or overpriced? Explain briefly. (30-50 words) (2+2+2=6 marks)
Step by Step Solution
There are 3 Steps involved in it

Get step-by-step solutions from verified subject matter experts