

Question: Question 4. Answer the following questions based on the graph below: Explain how yearly sales for a particular brand are calculated. Provide a definition for
Question 4.
Answer the following questions based on the graph below:
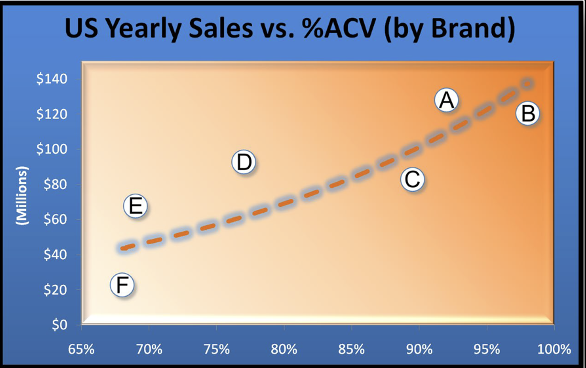
- Explain how yearly sales for a particular brand are calculated.
- Provide a definition for the yearly %ACV, Distribution of a brand.
- What does this graph imply about the relationship between sales with distribution? Explain.
- Does this graph imply anything about whether the effectiveness of non-distribution activities by some brands is superior to that of others? Explain.
US Yearly Sales vs. %ACV (by Brand) $140 ) $120 B $100 D $80 (Millions) E $60 $40 $20 F $0 65% 70% 75% 80% 85% 90% 95% 100%
Step by Step Solution
There are 3 Steps involved in it
1 Expert Approved Answer
Step: 1 Unlock

Question Has Been Solved by an Expert!
Get step-by-step solutions from verified subject matter experts
Step: 2 Unlock
Step: 3 Unlock