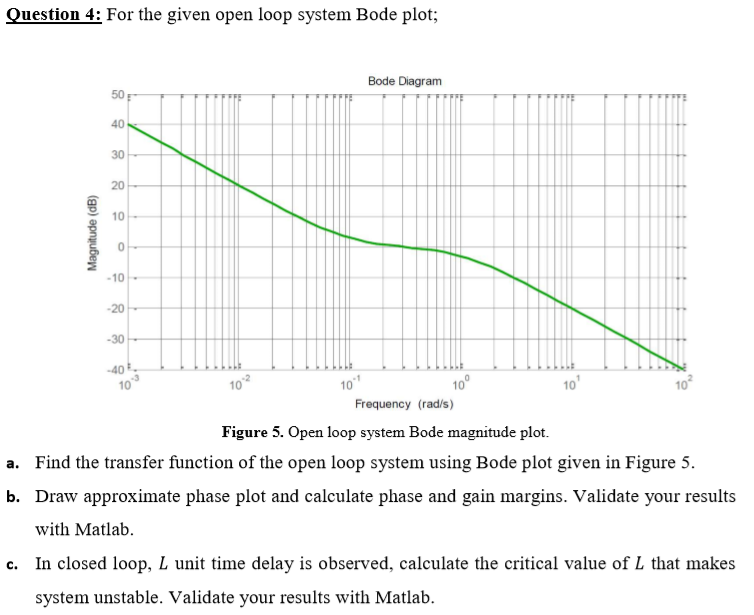
Question: Question 4: For the given open loop system Bode plot; Bode Diagram 50 40 30 20 10 Magnitude (dB) -10 -20 -30 -40 10 10

Question 4: For the given open loop system Bode

Question 4: For the given open loop system Bode plot; Bode Diagram 50 40 30 20 10 Magnitude (dB) -10 -20 -30 -40 10 10 10 10 100 Frequency (rad/s) Figure 5. Open loop system Bode magnitude plot. a. Find the transfer function of the open loop system using Bode plot given in Figure 5. b. Draw approximate phase plot and calculate phase and gain margins. Validate your results with Matlab. c. In closed loop, L unit time delay is observed, calculate the critical value of L that makes system unstable. Validate your results with Matlab. Question 4: For the given open loop system Bode plot; Bode Diagram 50 40 30 20 10 Magnitude (dB) -10 -20 -30 -40 10 10 10 10 100 Frequency (rad/s) Figure 5. Open loop system Bode magnitude plot. a. Find the transfer function of the open loop system using Bode plot given in Figure 5. b. Draw approximate phase plot and calculate phase and gain margins. Validate your results with Matlab. c. In closed loop, L unit time delay is observed, calculate the critical value of L that makes system unstable. Validate your results with Matlab

Step by Step Solution

There are 3 Steps involved in it

1 Expert Approved Answer
Step: 1 Unlock blur-text-image
Question Has Been Solved by an Expert!

Get step-by-step solutions from verified subject matter experts

Step: 2 Unlock
Step: 3 Unlock

Students Have Also Explored These Related General Management Questions!