

Question: Question 4 i. The figure below provides information on a univariate time series variable, labour (1): 6000 5600 han har hon 5200 4800 4400 4000
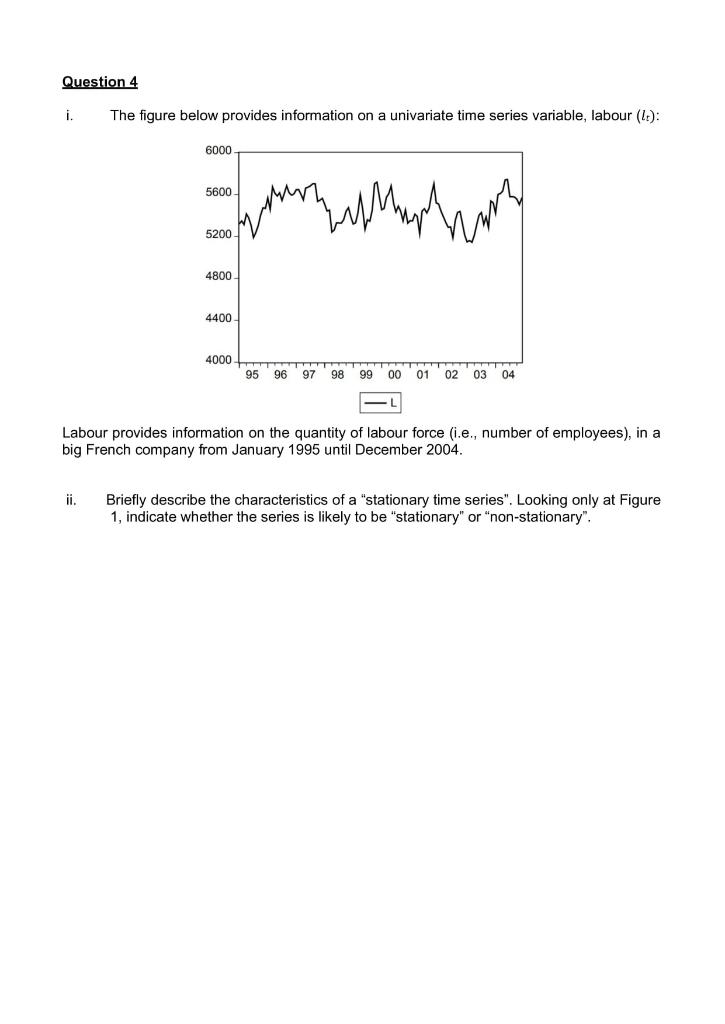
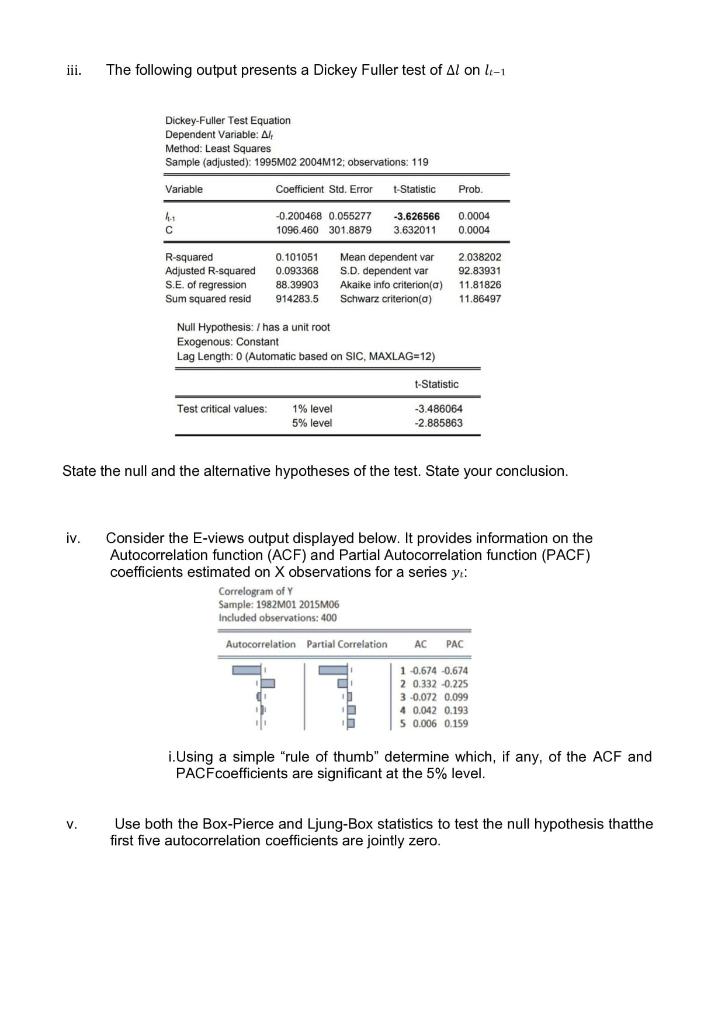
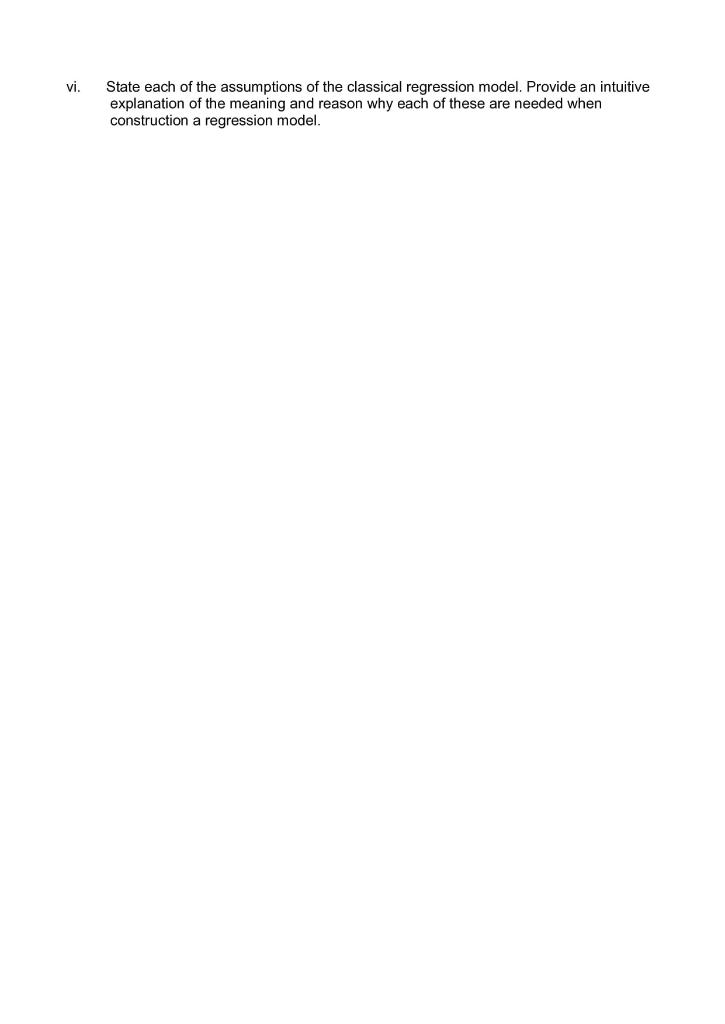
Question 4 i. The figure below provides information on a univariate time series variable, labour (1): 6000 5600 han har hon 5200 4800 4400 4000 95 96 97 98 99 00 01 02 03 04 Labour provides information on the quantity of labour force (i.e., number of employees), in a big French company from January 1995 until December 2004. ji Briefly describe the characteristics of a "stationary time series". Looking only at Figure 1, indicate whether the series is likely to be "stationary" or "non-stationary". iii. . The following output presents a Dickey Fuller test of Al on li-1 Dickey-Fuller Test Equation Dependent Variable: All Method: Least Squares Sample (adjusted): 1995M02 2004M12; observations: 119 Variable Coefficient Std. Error t-Statistic Prob. -0.200468 0.055277 1096.460 301.8879 -3.626566 3.632011 0.0004 0.0004 R-squared Adjusted R-squared S.E. of regression Sum squared resid 0.101051 0.093368 88.39903 914283.5 Mean dependent var S.D. dependent var Akaike info criterion(a) Schwarz criterion(a) 2.038202 92.83931 11.81826 11.86497 Null Hypothesis: / has a unit root Exogenous: Constant Lag Length: 0 (Automatic based on SIC, MAXLAG=12) t-Statistic Test critical values: 1% level 5% level -3.486064 -2.885863 State the null and the alternative hypotheses of the test. State your conclusion. iv. Consider the E-views output displayed below. It provides information on the Autocorrelation function (ACF) and Partial Autocorrelation function (PACF) coefficients estimated on X observations for a series y: Correlogram of Y Sample: 1982M01 2015M06 Included observations: 400 Autocorrelation Partial Correlation AC PAC d 1 -0.674 -0.674 2 0.332 -0.225 3 -0.072 0.099 4 4 0.042 0.193 5 0.006 0.159 i.Using a simple "rule of thumb" determine which, if any, of the ACF and PACFcoefficients are significant at the 5% level. V. Use both the Box-Pierce and Ljung-Box statistics to test the null hypothesis thatthe first five autocorrelation coefficients are jointly zero. vi. State each of the assumptions of the classical regression model. Provide an intuitive explanation of the meaning and reason why each of these are needed when construction a regression model. Question 4 i. The figure below provides information on a univariate time series variable, labour (1): 6000 5600 han har hon 5200 4800 4400 4000 95 96 97 98 99 00 01 02 03 04 Labour provides information on the quantity of labour force (i.e., number of employees), in a big French company from January 1995 until December 2004. ji Briefly describe the characteristics of a "stationary time series". Looking only at Figure 1, indicate whether the series is likely to be "stationary" or "non-stationary". iii. . The following output presents a Dickey Fuller test of Al on li-1 Dickey-Fuller Test Equation Dependent Variable: All Method: Least Squares Sample (adjusted): 1995M02 2004M12; observations: 119 Variable Coefficient Std. Error t-Statistic Prob. -0.200468 0.055277 1096.460 301.8879 -3.626566 3.632011 0.0004 0.0004 R-squared Adjusted R-squared S.E. of regression Sum squared resid 0.101051 0.093368 88.39903 914283.5 Mean dependent var S.D. dependent var Akaike info criterion(a) Schwarz criterion(a) 2.038202 92.83931 11.81826 11.86497 Null Hypothesis: / has a unit root Exogenous: Constant Lag Length: 0 (Automatic based on SIC, MAXLAG=12) t-Statistic Test critical values: 1% level 5% level -3.486064 -2.885863 State the null and the alternative hypotheses of the test. State your conclusion. iv. Consider the E-views output displayed below. It provides information on the Autocorrelation function (ACF) and Partial Autocorrelation function (PACF) coefficients estimated on X observations for a series y: Correlogram of Y Sample: 1982M01 2015M06 Included observations: 400 Autocorrelation Partial Correlation AC PAC d 1 -0.674 -0.674 2 0.332 -0.225 3 -0.072 0.099 4 4 0.042 0.193 5 0.006 0.159 i.Using a simple "rule of thumb" determine which, if any, of the ACF and PACFcoefficients are significant at the 5% level. V. Use both the Box-Pierce and Ljung-Box statistics to test the null hypothesis thatthe first five autocorrelation coefficients are jointly zero. vi. State each of the assumptions of the classical regression model. Provide an intuitive explanation of the meaning and reason why each of these are needed when construction a regression model
Step by Step Solution
There are 3 Steps involved in it

Get step-by-step solutions from verified subject matter experts