Question: (Question 4 - Please Answer This Question) (Question 1 - As a Reference for Question 4) Returning to a modification of Problem 1. Summarizes obtained
 (Question 4 - Please Answer This Question)
 (Question 1 - As a Reference for Question 4)
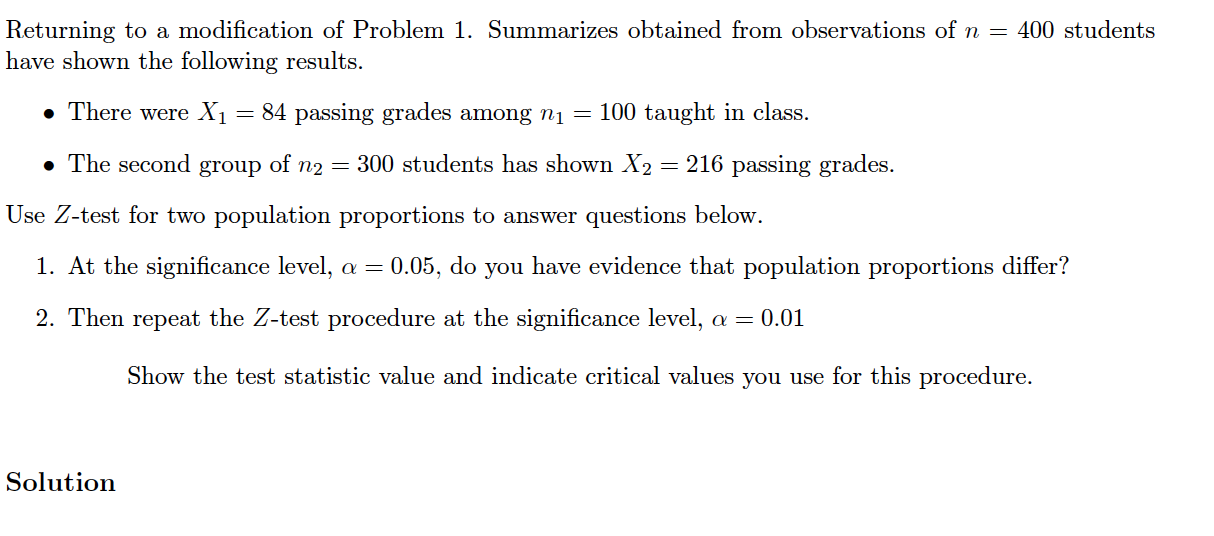
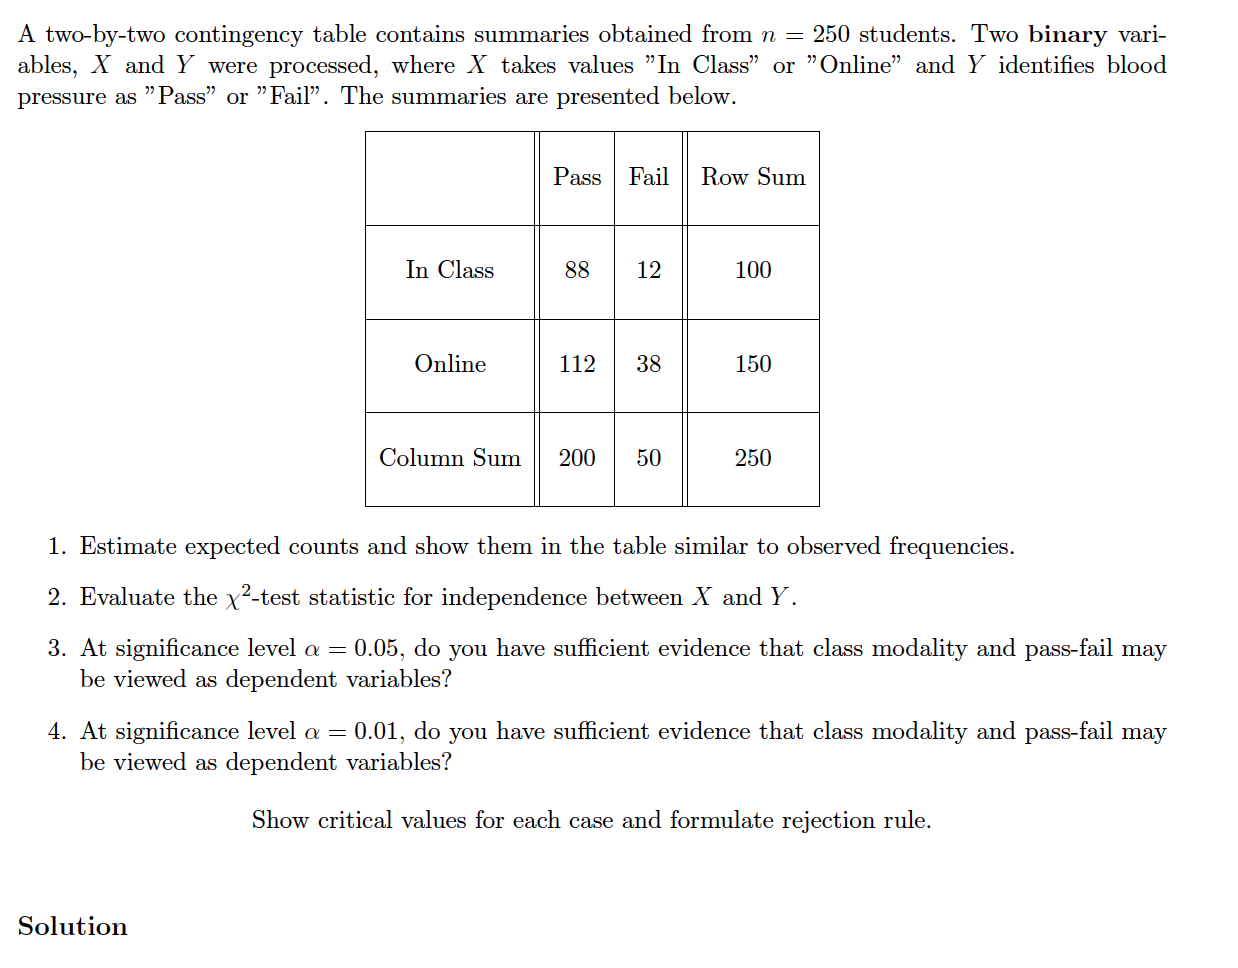
Returning to a modification of Problem 1. Summarizes obtained from observations of n = 400 students have shown the following results. There were X1 = 84 passing grades among n1 = 100 taught in class. The second group of n2 = 300 students has shown X2 = 216 passing grades. Use Z-test for two population proportions to answer questions below. 1. At the significance level, a = 0.05, do you have evidence that population proportions differ? 2. Then repeat the Z-test procedure at the significance level, a = 0.01 Show the test statistic value and indicate critical values you use for this procedure. Solution A two-by-two contingency table contains summaries obtained from n = 250 students. Two binary vari- ables, X and Y were processed, where X takes values In Class or "Online and Y identifies blood pressure as Pass" or "Fail. The summaries are presented below. Pass Fail Row Sum In Class 88 12 100 Online 112 38 150 Column Sum 200 50 250 1. Estimate expected counts and show them in the table similar to observed frequencies. 2. Evaluate the x2-test statistic for independence between X and Y. 3. At significance level a = 0.05, do you have sufficient evidence that class modality and pass-fail may be viewed as dependent variables? 4. At significance level a = 0.01, do you have sufficient evidence that class modality and pass-fail may be viewed as dependent variables? Show critical values for each case and formulate rejection rule. Solution Returning to a modification of Problem 1. Summarizes obtained from observations of n = 400 students have shown the following results. There were X1 = 84 passing grades among n1 = 100 taught in class. The second group of n2 = 300 students has shown X2 = 216 passing grades. Use Z-test for two population proportions to answer questions below. 1. At the significance level, a = 0.05, do you have evidence that population proportions differ? 2. Then repeat the Z-test procedure at the significance level, a = 0.01 Show the test statistic value and indicate critical values you use for this procedure. Solution A two-by-two contingency table contains summaries obtained from n = 250 students. Two binary vari- ables, X and Y were processed, where X takes values In Class or "Online and Y identifies blood pressure as Pass" or "Fail. The summaries are presented below. Pass Fail Row Sum In Class 88 12 100 Online 112 38 150 Column Sum 200 50 250 1. Estimate expected counts and show them in the table similar to observed frequencies. 2. Evaluate the x2-test statistic for independence between X and Y. 3. At significance level a = 0.05, do you have sufficient evidence that class modality and pass-fail may be viewed as dependent variables? 4. At significance level a = 0.01, do you have sufficient evidence that class modality and pass-fail may be viewed as dependent variables? Show critical values for each case and formulate rejection rule. Solution


