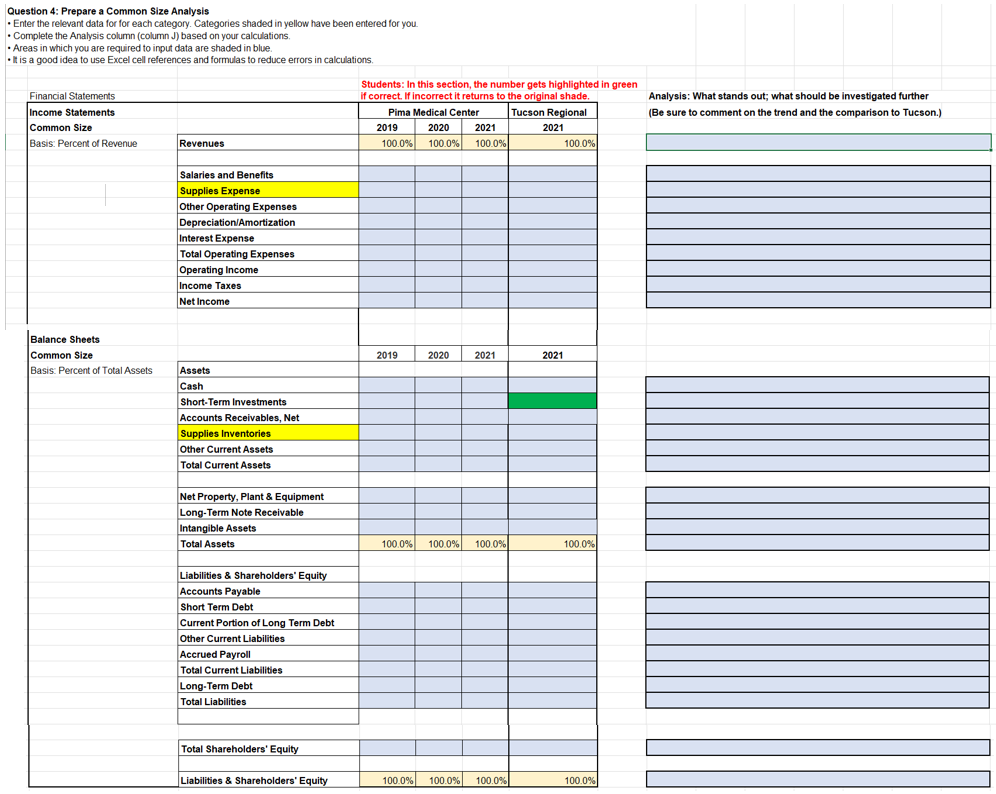
Question: Question 4: Prepare a Common Size Analysis . Enter the relevant data for for each category. Categories shaded in yellow have been entered for you.
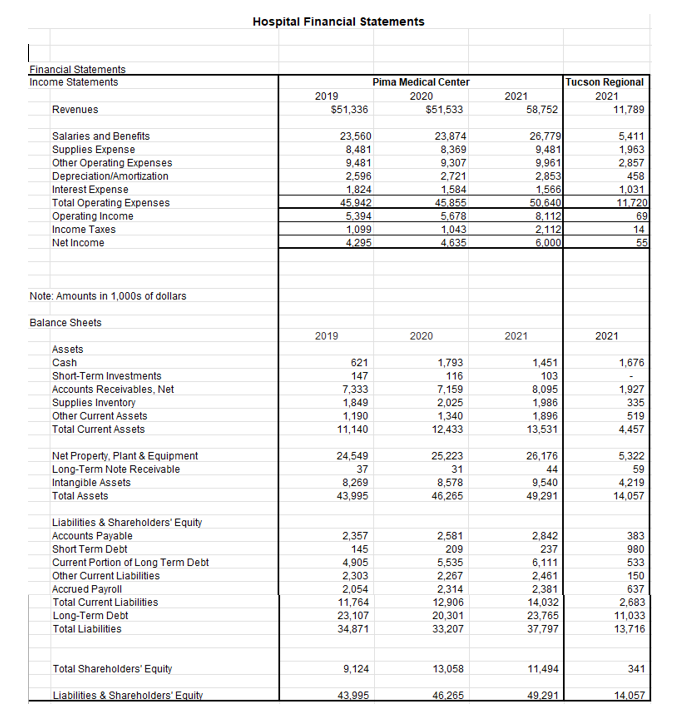
Question 4: Prepare a Common Size Analysis . Enter the relevant data for for each category. Categories shaded in yellow have been entered for you. . Complete the Analysis column (column J) based on your calculations . Areas in which you are required to input data are shaded in blue. . It is a good idea to use Excel cell references and formulas to reduce errors in calculations. Students: In this section, the number gets highlighted in green Financial Statements If correct. If incorrect it returns to the original shade. Analysis: What stands out; what should be investigated further Income Statements Pima Medical Center Tucson Regional (Be sure to comment on the trend and the comparison to Tucson.) Common Size 2019 2020 2021 2021 Basis: Percent of Revenue Revenues 100.0% 100.0% 100 0% 100 0% Salaries and Benefits Supplies Expense Other Operating Expenses Depreciation/Amortization Interest Expense Total Operating Expenses Operating Income Income Taxes Net Income Balance Sheets Common Size 2019 2020 2021 2021 Basis: Percent of Total Assets Assets Cast Short-Term Investments Accounts Receivables, Net Supplies Inventories Other Current Assets Total Current Assets Net Property, Plant & Equipment Long-Term Note Receivable Intangible Assets Total Assets 100.0% 100 0% 100.0% 100.0% Liabilities & Shareholders' Equity Accounts Payable Short Term Debt Current Portion of Long Term Debt Other Current Liabilities Accrued Payroll Total Current Liabilities Long-Term Debt Total Liabilities Total Shareholders' Equity Liabilities & Shareholders' Equity 100 0% 100.0% 100.0% 100.0%Hospital Financial Statements Financial Statements Income Statements Pima Medical Center Tucson Regional 2019 2020 2021 2021 Revenues $51,336 $51,533 58,752 11,789 Salaries and Benefits 23,560 23,874 26,779 5,411 Supplies Expense 8,481 8,369 9,481 1,963 Other Operating Expenses 9.481 9,307 9.961 2.857 Depreciation/Amortization 2,596 2,721 2,853 458 Interest Expense 1.824 1,584 1,566 1.031 Total Operating Expenses 15.942 15.855 50.640 11.720 Operating Income 5.394 5.678 8.112 69 Income Taxes 1.099 1,043 2,112 14 Net Income 4.295 1.635 6.000 551 Note: Amounts in 1,000s of dollars Balance Sheets 2019 2020 2021 2021 Assets Cash 621 1,793 1,451 1,676 Short-Term Investments 147 116 103 Accounts Receivables, Net 7,333 7,159 8,095 1,927 Supplies Inventory 1,849 2,025 1,986 335 Other Current Assets 1,190 1,340 1,896 519 Total Current Assets 11,140 12,433 13,531 4,457 Net Property, Plant & Equipment 24,549 25,223 26,176 5,322 Long-Term Note Receivable 37 31 44 59 Intangible Assets 8,269 8,578 9,540 4,219 Total Assets 43,995 46,265 49,291 14,057 Liabilities & Shareholders' Equity Accounts Payable 2,357 2,581 2,842 383 Short Term Debt 145 209 237 980 Current Portion of Long Term Debt 4,905 5,535 6,111 533 Other Current Liabilities 2,303 2,267 2,461 150 Accrued Payroll 2,054 2,314 2,381 637 Total Current Liabilities 11,764 12,906 14,032 2,683 Long-Term Debt 23,107 20,301 23,765 11,033 Total Liabilities 34,871 33,207 37,797 13,716 Total Shareholders' Equity 9,124 13,058 11,494 341 Liabilities & Shareholders' Equity 43.995 46.265 49.291 14.057
Step by Step Solution
There are 3 Steps involved in it
1 Expert Approved Answer
Step: 1 Unlock
Question Has Been Solved by an Expert!
Get step-by-step solutions from verified subject matter experts
Step: 2 Unlock
Step: 3 Unlock
Students Have Also Explored These Related Finance Questions!