

Question: QUESTION 4 Refer to the attached Excel file HW Control Charts using the X - Chart tab data; the UCL and LCL of
QUESTION
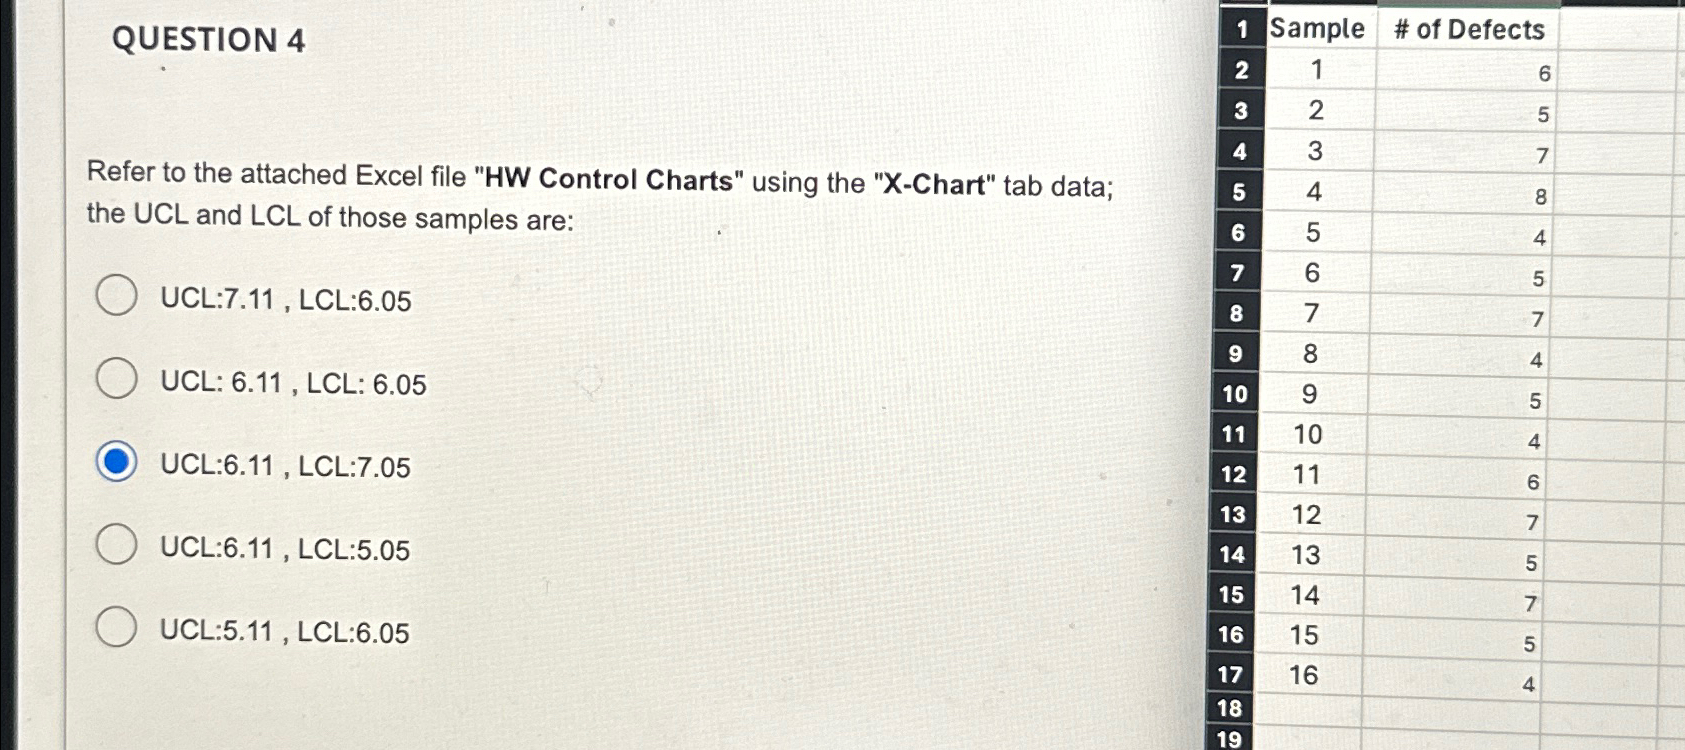
Refer to the attached Excel file HW Control Charts" using the XChart" tab data; the UCL and LCL of those samples are:
UCL: LCL:
UCL: LCL:
UCL: LCL:
UCL: LCL:
UCL: LCL:
tableSample,# of Defects
Step by Step Solution
There are 3 Steps involved in it
1 Expert Approved Answer
Step: 1 Unlock

Question Has Been Solved by an Expert!
Get step-by-step solutions from verified subject matter experts
Step: 2 Unlock
Step: 3 Unlock